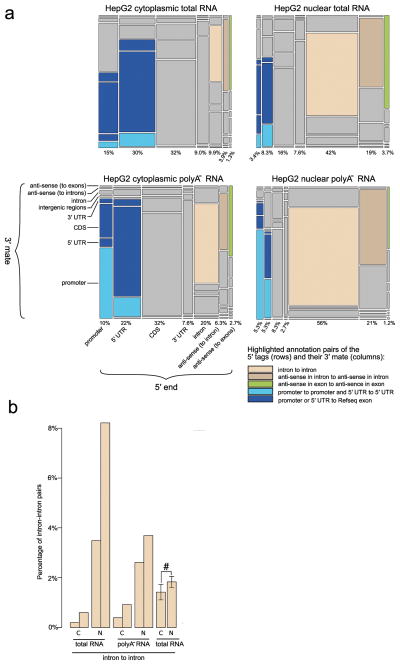
Figure 3. Promotome-transcriptome analysis with CAGEscan.
(a) Annotation matrix summarizing the connections between genomic regions by CAGEscan mate pairs. We divided the genome in features that are intergenic, intron, promoter, 5′ UTR, coding sequence (CDS), 3′ UTR, antisense in introns, or antisense in exons according to RefSeq. The CAGEscan mate pairs were counted for each combination of features. For the libraries made from cytoplasmic, nuclear, cytoplasmic poly-A− and nuclear poly-A− RNAs, a matrix of 8 rows by 7 columns representing the indicated transcript features is plotted. The area of each cell is proportional to the number of pairs connecting a given combination of features. The percentages indicated below each column represent the fraction of mate pairs initiated from the same feature. The pairs starting in an intergenic feature were discarded to better visualize the differences between the other combinations. Notable combinations of features are colored. (b) The nuclear compartment contains more intron-intron pairs. Pairs of bars indicate that the libraries are technical replicates. For the experiment with six biological replicates, the percentages were averaged (error bars represent s.d., n = 6), and we observe a statistically significant difference (#) (P = 0.019. paired Student’s t-test).

