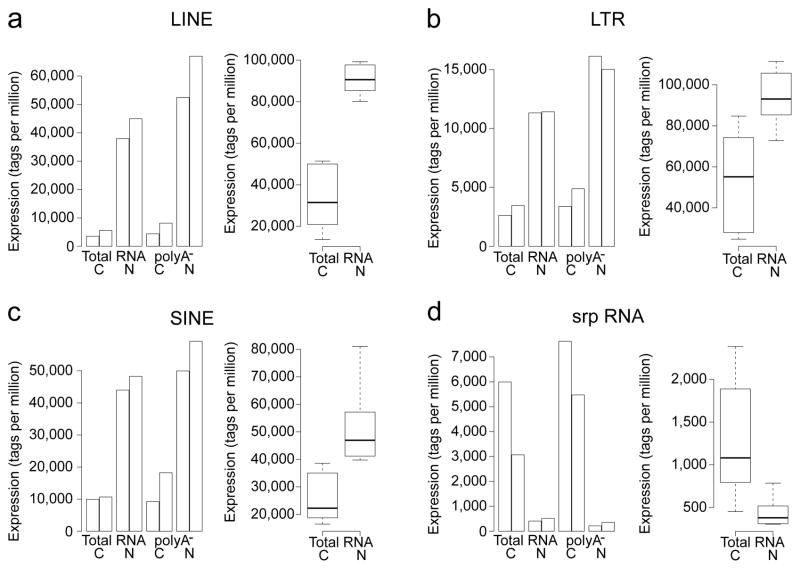
Figure 5. Expressed repeat elements surveyed by CAGEscan.
Expression in tags per million of LINE, LTR, SINE, and srpRNA repeated elements in cytoplasmic (C) and nuclear fractions (N) from total and non-polyadenlyated RNA (poly-A−). Adjacent bars indicate technical replicates. Whisker plots summaries data from six additional biological replicates. The boxplots and whisker plots sub-panels use different scales. The nucleus appears strongly enriched for LINE, LTR and SINE transcripts, which are non-polyadenylated, while the cytoplasm appears strongly enriched in srpRNA, both in the total RNA and the non-polyadenylated fraction.

