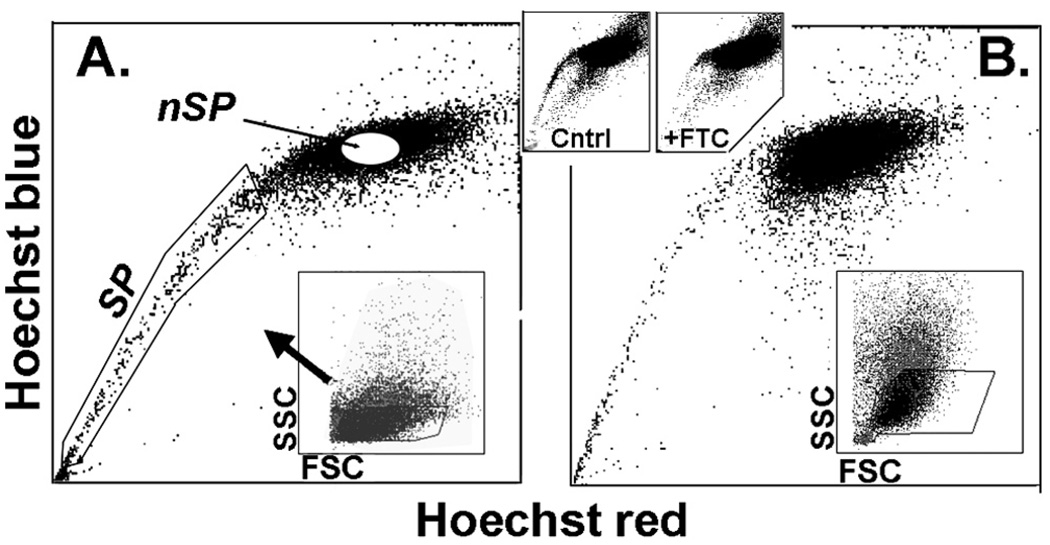
FIGURE 1.
Side populations in pig ocular surface cells. (A) Limbus. (B) Conjunctiva. SP and nSP cell regions are indicated in (A). Bottom insets: images indicate that cells were collected only from limited side (SSC)- and forward (FSC)-scatter ranges. Top insets: data show that the SP was greatly reduced by inclusion of the ABCG2-specific inhibitor FTC.

