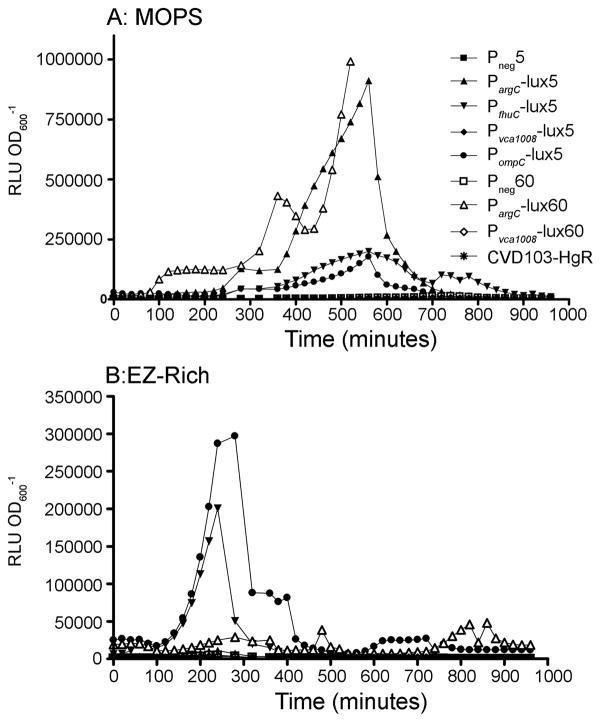
Figure 1.
Luciferase kinetics and stability. The symbols shown in A are used for both panels. The symbols for 5-copy plasmids are solid and those for 60-copy plasmids are open. A) and B) show strains grown in 96-well plates in minimal and rich media respectively. Each value is the mean of triplicate cultures and is representative of at least 3 experiments. The values of 60-copy PargC strain are cut-off at 500 minutes; this strain goes on to achieve a peak level of 3.94 × 10⁶ at 780 minutes and then rapidly declines like the other strains.

