Figure 1.
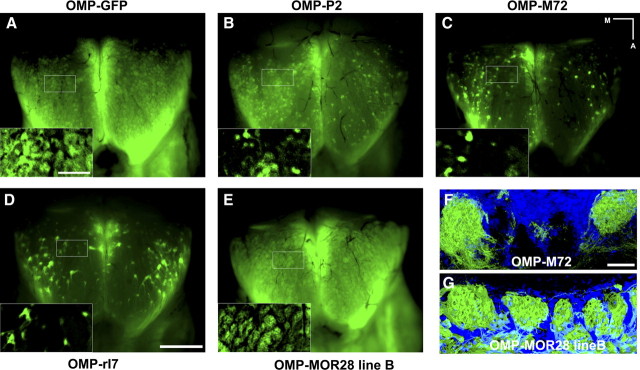
Projection patterns of OSNs expressing OMP-tgORs. A–E, Whole-mount fluorescence of the dorsal OB reveals GFP-expressing neurons innervating broadly distributed glomeruli. A, Control mice expressing a TetO-GFP transgene under the control of OMP-TTA illustrate the pattern of glomeruli in wild-type animals. B–E, OSNs expressing various OMP-tgORs target glomeruli that are broadly distributed throughout the dorsal OB and similar in size to those of control mice (see insets for detail). The number of fluorescent glomeruli reflects the different levels of expression of the transgene. Generally 10–30% of OSNs express OMP-tgORs (B–D); however, OMP-MOR28 line B (E) is expressed in 80–90% OSNs and OB fluorescence closely matches that of control mice (A). F, G, Confocal images of the glomerular layer of OMP-tgOR mice counterstained with DAPI (blue) show that glomeruli targeted by OSNs expressing OMP-M72 (F) and OMP-MOR28 line B (G) appear filled with GFP- (and tgOR-) expressing fibers and are similar in morphology. Also note interspersed glomeruli not containing innervation from GFP-positive OSNs in OMP-M72 mice where the transgene is expressed in a subset (10–30%) of OSNs (F). Scale bars: A (for A–E insets), 250 μm; D (for A–E), 1 mm; F (for F and G),50 μm. Medial (M) and anterior (A) directions in whole-mount images are indicated.

