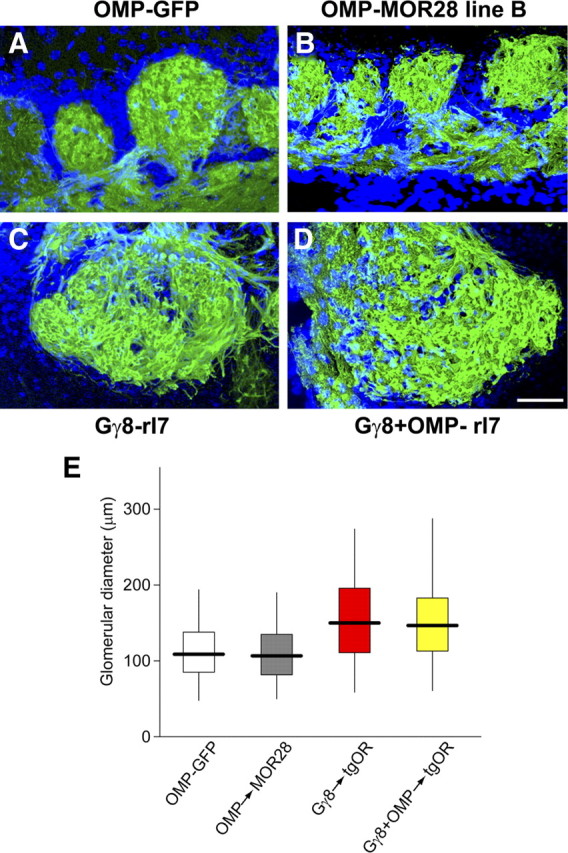
Figure 5.

Qualitative and quantitative analysis of glomerular size in tgOR mice. A–D, Confocal images of the dorsal OB of mice expressing OMP-GFP (A) or tgORs under the control of OMP (B), Gγ8 (C), or both Gγ8+OMP promoters (D) show transgene expression (green) and are counterstained with DAPI (blue). C, D, In animals carrying a Gγ8-TTA transgene, some of the labeled glomeruli are substantially larger than the largest glomeruli of control animals. Scale bar, 50 μm. E, Photomicrographs of 3-week-old animals were used for quantitative analysis of GFP-labeled glomerular diameter for OMP-GFP controls (n = 553 glomeruli), OMP-tgOR (MOR28 line B, n = 414), Gγ8-tgOR (M72 and rI7, n = 277), and Gγ8+OMP-tgOR (M72 and rI7, n = 434). The plot indicates the median glomerular diameter (solid line), the 25th and 75th percentiles (boxed) and the 2.5 and 97.5 percentiles (whiskers); the mean glomerular diameter of Gγ8-tgOR and Gγ8+OMP-tgOR mice is significantly larger than that of control or OMP-tgOR animals (p < 0.0001 in each case). Glomerular diameter increased in size regardless of direction of sections, thus the presence of a Gγ8-tgOR results in an approximately threefold increase in volume.
