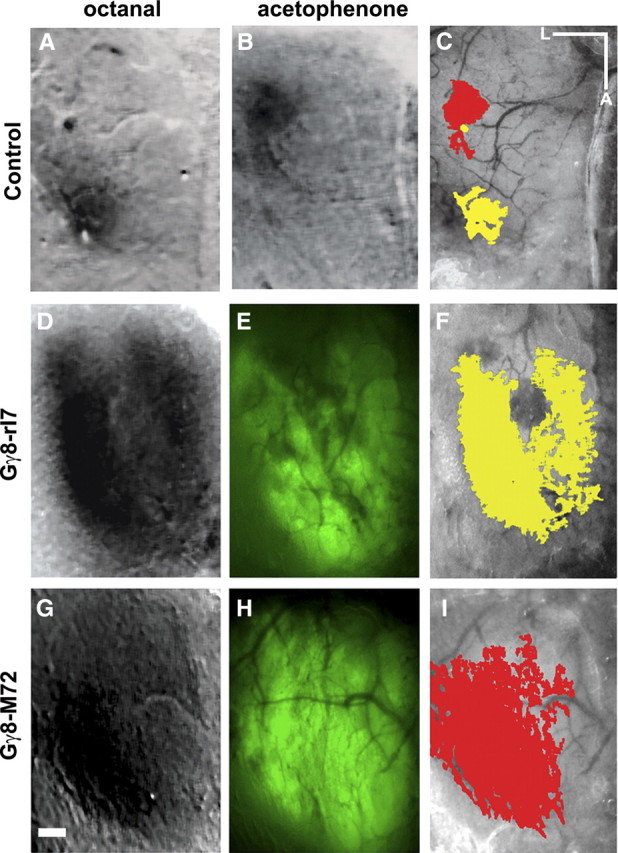
Figure 6.

Activation of tgORs by odorants leads to widespread activity in the OB. A–C, In control animals, ISI reveals discrete regions of activity (dark spots) elicited by octanal (A) and acetophenone (B); peak areas of activity have been color coded (octanal, yellow; acetophenone, red) and superimposed on an image of the OB (C). D–I, Gγ8-tgOR mice show widespread responses to cognate ligands, Gγ8-rI7 to octanal (D, F) and Gγ8-M72 to acetophenone (G, I), that correspond with transgene expression (GFP fluorescence, E, H). Scale bar, 250 μm. Lateral (L) and anterior (A) directions are indicated.
