Figure 3.
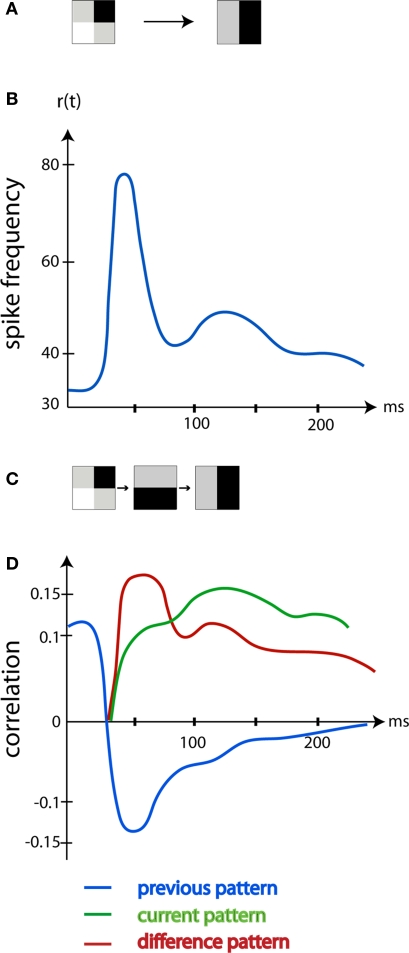
The image decoded by the area 17 neurons changes over time. (A) The left pattern was shown. At time 0 ms the pattern shifted to the right pattern. (B) The mean r(t) in Hz of the area 17 neurons mapping the new pattern (average of five animals). (C) The old pattern (left), the difference between the old pattern and the new pattern (middle), the new pattern (right). (D) The average correlation between the old, the difference pattern and the new pattern and the r(t) of area 17 mapping neurons. Note that, corresponding to the ON response induced by the change to the new pattern, the neurons are mostly correlated with the difference between the old and the new pattern. After 90 ms the neurons code mostly for the current pattern. (Modified from Eriksson et al., 2010).

