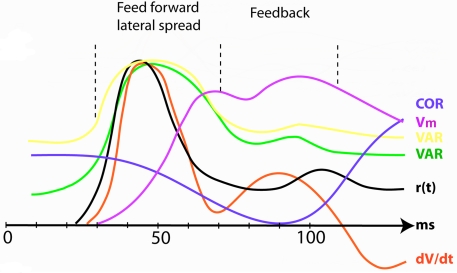
Figure 4.
The increase and reduction in dimensionality at the mapping site of the object in visual area 17 after introduction of a stationary object at time 0. COR correlation in r(t) between pairs of neurons (Smith and Kohn, 2008). Vm population membrane voltage. VAR (yellow) variance of the population membrane potential (calculated from Roland et al., 2006); VAR (green) trial-by-trial variance in the firing rate (Gawne et al., 1996); r(t) firing rate; dV/dt time derivative of membrane potential V (proportional to net membrane current); (Eriksson et al., 2008). As the variance decrease and the correlations increase in the feedback interval the dimensionality reduces. All data normalized to maximum values.

