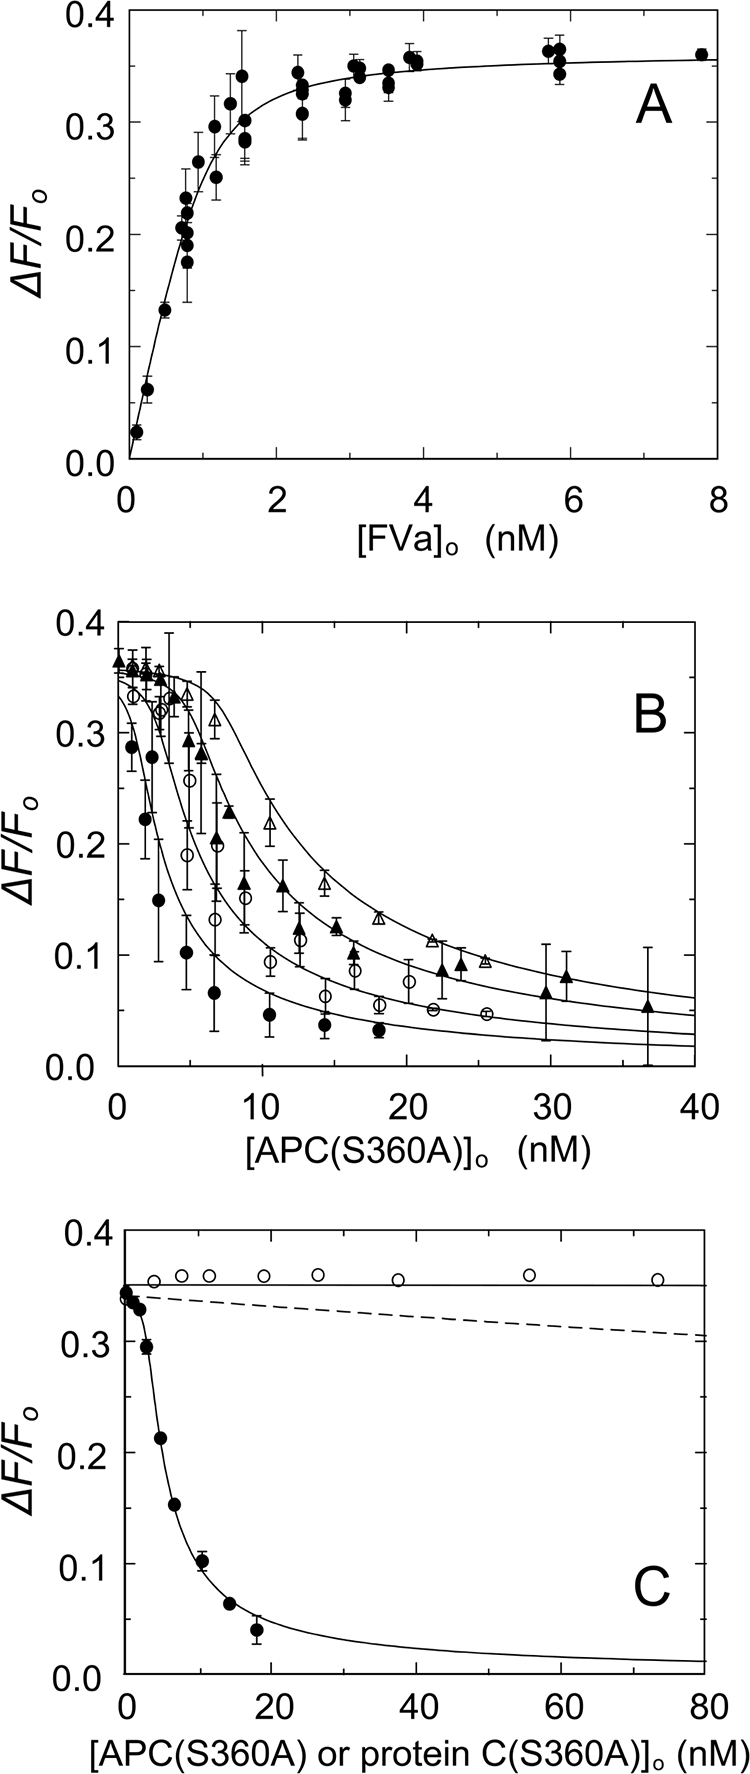
FIGURE 2.

Equilibrium binding of native FVa to OG-FXa and dissociation of the OG-FXa·FVa complex by APC(S360A) and protein C(S360A). A, the fractional increase in fluorescence (ΔF/Fo) of 1.2 nm OG-FXa as a function of the total concentration of FVa ([FVa]o) in the presence of 50 μm phospholipid vesicles (20:60:20, DOPS:DOPC:DOPE) shown for data pooled from six independent titrations (●). B, effect of varying APC(S360A) concentrations on OG-FXa·FVa complexes preformed after incubating 1.2 nm OG-FXa with, 2.35 (●), 3.72 (○), 5.85 (▴), and 7.8 (▵) nm FVa. The solid lines in A and B represent nonlinear least square fits of the combined data with the cubic competitive binding equation with n = 0.82 ± 0.18 FVa/OG-FXa (mol/mol) fixed, and fitted parameters of KP = 0.14 ± 0.06 nm, m = 0.92 ± 0.13 APC(S360A)/FVa (mol/mol), KC = 0.11 ± 0.05 nm, and ΔFmax/Fo = 37 ± 2%. C, effect of varying APC(S360A) (●) or protein C(S360A) (○) concentrations of preformed OG-FXa·FVa complexes (1.2 nm OG-FXa and 5.8 nm FVa). The solid line for APC(S360A) displacement of FVa from OG-FXa represents the fit by the cubic equation with the parameters given in B, except the fitted values of m = 1.3 ± 0.2 APC(S360A)/FVa (mol/mol), KC = 0.08 ± 0.02 nm, and ΔFmax/Fo = 35 ± 1%. The flat solid line was drawn through the protein C(S360A) data at ΔF/Fo = 0.35. The error bars represent the 95% confidence interval. The dashed line represents a simulation with KC = 28 nm (200 × KP). Fluorescence titrations were performed and analyzed as described under “Experimental Procedures.”
