FIGURE 2.
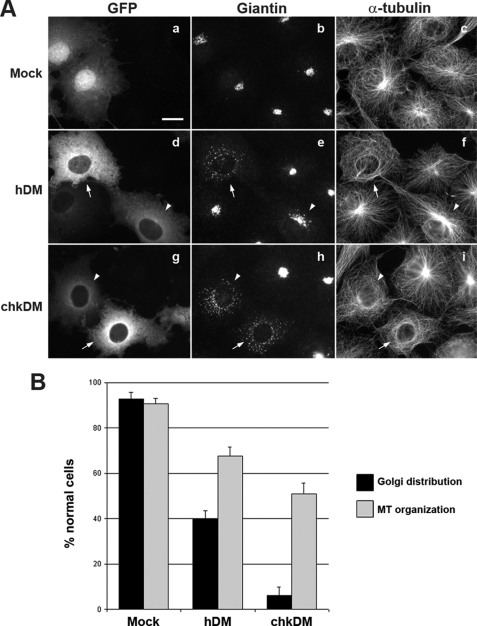
Impact of human and chicken p50/DM overexpression on dynactin functions. A, COS7 cells expressing GFP, GFP-hDM, or GFP-chkDM (panels a, d, and g) were stained with an anti-Giantin pAb (panels b, e, and h) and an anti-α-tubulin mAb (panels c, f, and i). Arrows and arrowheads on panels d–f and g–i show transfected cells expressing high and low levels of the GFP-hDM fusions, respectively. Scale bar, 10 μm. B, Golgi distribution (black bars) and microtubule (MT) organization (gray bars) were quantified over 100 cells expressing GFP (mock), GFP-hDM (hDM), or GFP-chkDM (chkDM). Results are expressed as the percentage of transfected cells showing normal Golgi distribution, either concentrated in the perinuclear region (see nontransfected cells) or showing only slight dispersal (see arrowhead in panel e), and a radial organization of microtubules anchored at the centrosome. Values are the means of three independent experiments; error bars represent 1 standard deviation from the mean.

