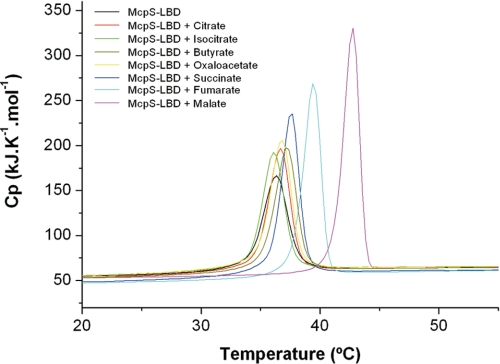
FIGURE 9.
Analysis of McpS-LBD by differential scanning calorimetry in the absence and presence of the ligands. Protein was at a concentration of 36 μm. Ligands were added at a concentration of 1 mm except for isocitrate, for which the concentration was increased to 3 mm to achieve complete saturation of the protein. Derived parameters are given in Table 1.

