FIGURE 5.
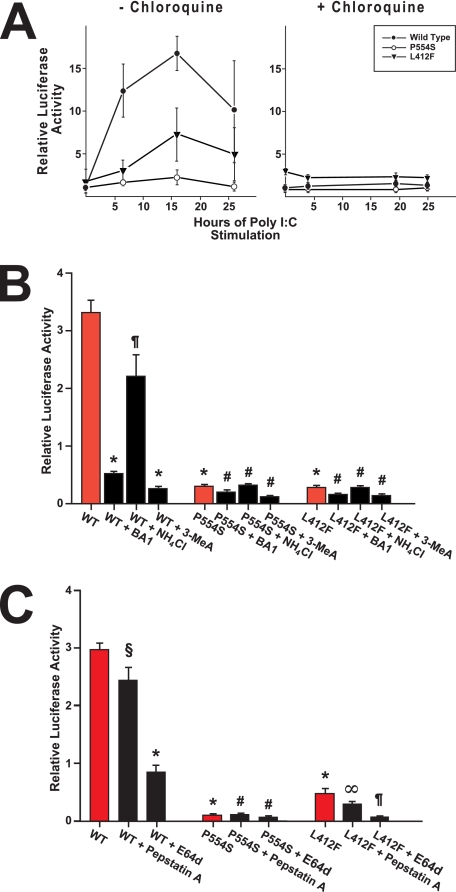
Autophagy inhibitors blunt type I interferon signaling by TLR3. Panel A, chloroquine inhibits type I interferon signaling in response to ligand. Stable HEK cells expressing TLR3-HA variants were transfected with pISRE-LUC and then stimulated with poly(I:C) in the absence (left) or presence of chloroquine (right). Measured luciferase activities in the whole cell extracts were normalized to exogenous TLR3 expression and expressed relative to unstimulated WT TLR3-expressing cells. The results are the means ± S.E. of three independent measurements. Panel B, stable 293 cells expressing WT, Ser-554 (P554S), or Phe-412 (L412F) TLR3-HA were transfected with pISRE-LUC and then stimulated with poly(I:C) in the absence (red bars) or presence of either bafilomycin A1 (BA1) or NH4Cl or 3-methyladenine (3-MeA) (black bars). Luciferase activities in the cell extracts were measured, normalized to exogenous TLR3 expression, and expressed relative to unstimulated WT TLR3-expressing cells (1.00 ± 0.08, not shown). The results represent the mean ± S.E. of four measurements. *, p < 0.001 versus stimulated WT cells. ¶, p = NS versus stimulated WT; #, p = NS versus stimulated Ser-554 or Phe-412 cells. Panel C, inhibition of lysosomal proteolysis reduces TLR3 type I interferon signaling. Stable 293 cells expressing WT, Ser-554 (P554S), or Phe-412 (L412F) TLR3-HA were transfected with pISRE-LUC and then stimulated with poly(I:C) in the absence (red bars) or presence of pepstatin A or the thiol-protease inhibitor E64d (black bars). Normalized luciferase activities are expressed relative to unstimulated WT TLR3-expressing cells (1.00 ± 0.07, not shown). The results represent the means ± S.E. of four measurements. *, p < 0.001 versus stimulated WT; ¶, p < 0.001 versus stimulated Phe-412 cells; #, p = NS versus stimulated Ser-554 cells; §, p = NS versus stimulated WT; ∞, p = NS versus stimulated Phe-412 cells.

