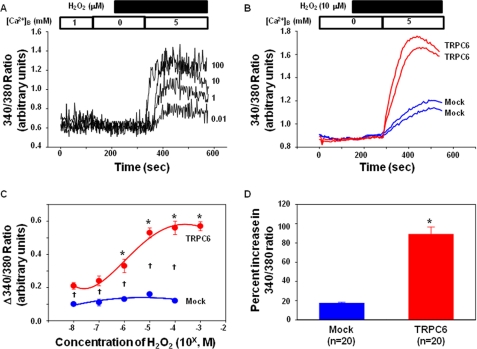
FIGURE 2.
Effect of H2O2 on the intracellular Ca2+ signal in TRPC6-expressing and empty vector-transfected HEK293T cells. A, representative traces, showing the changes in intracellular Ca2+ level upon 5 mm Ca2+ readdition to a Ca2+ free bathing solution in cells treated with different concentrations of H2O2. The Ca2+ concentration in the bathing solution is indicated by the numbers inside the top open bar. Application of H2O2 is indicated by the top solid bar. [Ca2+]B indicates the Ca2+ concentration in the bathing solution. The numbers next to each trace indicate the concentration of H2O2 (μm) applied. B, representative traces, displaying intracellular Ca2+ response to Ca2+ readdition in vector-transfected (Mock) and rTRPC6-transfected (TRPC6) cells in the presence of 10 μm H2O2. The Ca2+ concentration in the bathing solution is indicated by the numbers inside the top open bar. Application of H2O2 is indicated by the top solid bar. [Ca2+]B indicates the Ca2+ concentration in the bathing solution. C, summary data from five sets of TRPC6-transfected cells and two sets of empty vector-transfected cells, showing a dose-dependent response of Ca2+ entry on H2O2 treatments in TRPC6-expressing but not in vector-transfected cells. Δ340:380 ratio indicates the difference in the values before addition and the peak values after addition of 5 mm Ca2+ solution, representing the Ca2+ entry response. The numbers of cells in each group are from 16 to 25. *, p < 0.05, compared with 10−8 m in TRPC6-transfected cells; †, p < 0.05, comparison between TRPC6-transfected and Mock-transfected cells at corresponding doses. D, percent increases in the ratios of 340:380 in response to 10 μm H2O2 in Mock- and TRPC6-transfected cells. n indicates the number of cells analyzed. *, p < 0.05, TRPC6 versus Mock.

