FIGURE 3.
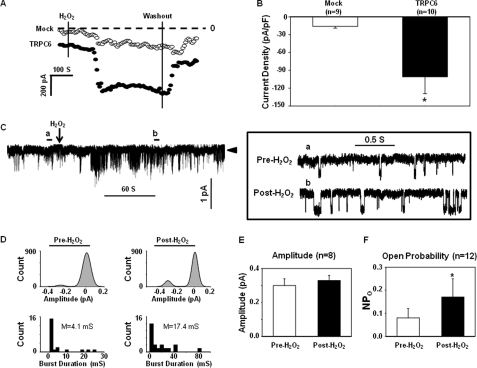
Effect of H2O2 on whole-cell currents (A and B, whole-cell patch) and single channel currents (C–F, cell-attached patch) in TRPC6-expressing HEK293T cells. A, representative whole-cell current measurements obtained by a Gap-free protocol in a Mock (open circles)- and a TRPC6-transfected (solid circles) cell at a holding potential of −60 mV. The dashed lines indicate zero currents. Application and removal of H2O2 are indicated by the vertical lines. B, summary data, showing the H2O2 effect on the whole-cell currents in the Mock control and TRPC6-expressing cells. The responses were measured by the difference between the membrane current before application of H2O2 and the peak current after application of H2O2. The whole-cell currents are expressed as current density (pA/pF), normalized to the cell membrane capacitance. n indicates the number of cells analyzed. Asterisk indicates statistically significant difference compared with Mock (Student's t test). C, representative traces of single channel currents in a cell-attached patch. Left panel, a real time continuous recording. The arrowhead indicates the closed state of the channels. Downward deflections indicate inward currents. Right panel, the time-expanded portions of the selected regions in the upper trace, indicated by a (Pre-H2O2) and b (Post-H2O2). D, amplitude histograms (upper panels) and open time distributions (bottom panels) of the currents before (left panels) and after (right panels) application of H2O2 in the traces shown in C. The amplitude histograms were fitted to Gaussian function. M in the bottom panels indicates mean open time. E, single channel amplitudes before and after application of 10 μm H2O2. n indicates the number of cells analyzed. F, effect of H2O2 on the NPo of TRPC6 channels in 12 cells. *, p < 0.05, compared with pre-H2O2 (paired Student's t test). The cells in each group of B, E, and F were from at least four sets of transfection.

