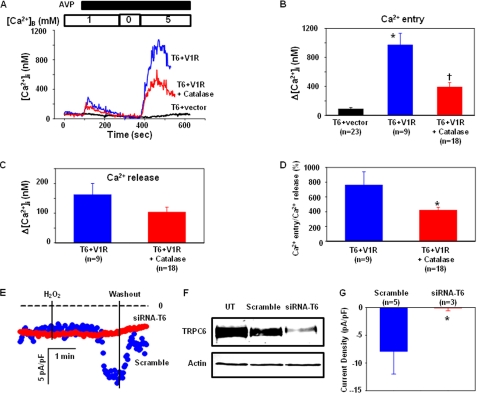
FIGURE 4.
A–D, Ca2+ imaging experiments, showing involvement of endogenous H2O2 in AVP-stimulated Ca2+ entry. A, representative traces, showing the AVP-evoked Ca2+ response in HEK293T cells expressing TRPC6 and an empty vector (T6+vector) or in cells co-transfected with TRPC6 and AVP V1R in the presence (T6+V1R+Catalase) or absence (T6+V1R) of PEG-catalase (250 units/ml for 30 min). Ca2+ concentration in the bathing solution is indicated by the numbers inside the top open bar. Application of 100 nm AVP is indicated by the top solid bar. [Ca2+]B indicates the Ca2+ concentration in the bathing solution. B, summary data, showing Ca2+ entry responses in different groups. *, p < 0.05, compared with T6 + vector; †, p < 0.05, compared with T6 + vector and T6 + V1R. C, effect of catalase on AVP-induced Ca2+ release in cells co-transfected with TRPC6 and AVP V1R. D, effect of catalase on normalized Ca2+ entry (ratio of Ca2+ entry to Ca2+ release) in response to AVP stimulation. *, p < 0.05, compared with T6 + V1R. B–D, n indicates the number of cells analyzed from 4 to 5 sets of transfection. E–G, in A7r5 cells. E, whole-cell patch clamp, showing inward currents in response to 100 μm H2O2 in A7r5 with (siRNA-T6) and without (Scramble) knockdown of TRPC6 at a holding potential of −60 mV. The dashed lines indicate zero currents. Application and removal of H2O2 were indicated by the vertical lines. F, Western blot, showing TRPC6 expression levels in A7r5 cells transfected with TRPC6 siRNA sequence (siRNA-T6) and scrambled sequence (Scramble). Actin served as a loading control. UT, untransfected. G, summary data, showing the H2O2 effect on whole-cell currents in A7r5 cells with (SiRNA-T6) and without (Scramble) knockdown of TRPC6. The responses were measured by the difference between the membrane current before application of H2O2 and the peak current after application of H2O2. The whole-cell currents were expressed as current density (pA/pF), normalized to the cell membrane capacitance. n indicates the number of cells analyzed from three sets of transfection. Asterisk indicates statistically significant difference compared with Scramble (Student's t test).

