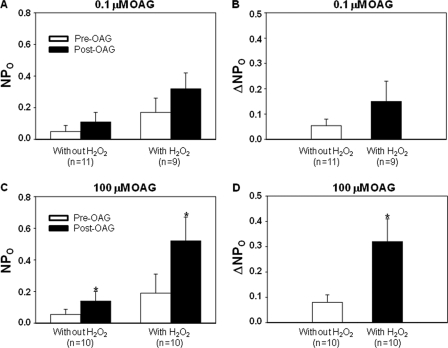
FIGURE 7.
Cell-attached patch clamp, showing the OAG effect on channel activity in TRPC6 expressing HEK293T cells with and without pretreatment with H2O2 (10 μm for 3 min). A and B, cells were stimulated with 0.1 μm OAG. C and D, cells were stimulated with 100 μm OAG. A and C indicate the channel activity (NPo) before and after OAG treatment in the presence and absence of H2O2. B and D show the difference in OAG-induced increase in channel activity (ΔNPo) with and without existence of H2O2. n indicates the number of cells analyzed, and each group represents at least four sets of transfection. *, p < 0.05, versus pre-OAG in C, and versus “Without H2O2” in D.

