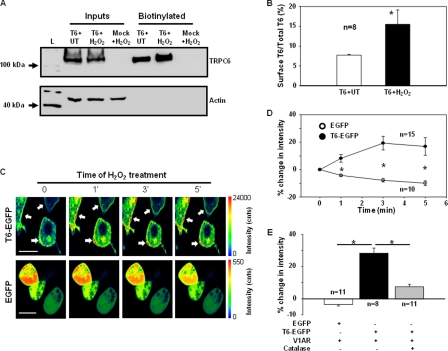
FIGURE 8.
Analysis of TRPC6 trafficking to the cell surface in response to H2O2. A, biotinylation of TRPC6 protein in HEK293T cells transfected with TRPC6 (T6) or empty vector (Mock) with and without H2O2 stimulation. L, a protein ladder; T6+UT, TRPC6-expressing cells without H2O2 treatment; T6+H2O2, TRPC6-expressing cells treated with 10 μm H2O2 for 3 min; Mock+H2O2, empty vector-transfected cells treated with 10 μm H2O2 for 3 min; Inputs, the whole-cell lysates (unbiotinylated), ∼1:10 of the lysates used for biotinylation. B, quantitative analysis of the cell surface TRPC6 protein with and without H2O2 stimulation. Data were expressed as percentages of integrated optical density of TRPC6 immunoblots in biotinylated fractions to the corresponding inputs, calculated by (integrated optical density of biotinylated TRPC6 blot/(integrated optical density of TRPC6 blot in input × 10)) × 100. n indicates the number of independent experiments. The optical density of immunoblots was measured with a software provided by AlphaEaseFC Imaging System (Alpha Innotech). Asterisk indicates significant difference compared with T6+UT. C, representative confocal microscopy photographs, showing TRPC6 trafficking to the region of the plasma membrane in response to 10 μm H2O2 stimulation in the cells transfected with TRPC6-EGFP (T6-EGFP), but not in the cells transfected with EGFP alone. Images were consecutively captured before application, immediately, 2, and 4 min after application of H2O2 (labeled with 0, 1′, 3′, and 5′, respectively). The duration of scanning one image was ∼1 min. The rainbow bars on the right indicates the fluorescence intensity in arbitrary units. Arrows indicate the sites of an increase in fluorescence intensity compared with before application of H2O2 (time 0). The horizontal bars in the left panels represent 20 μm. D, time course changes in fluorescence intensity on the cell surface in response to H2O2 in TRPC6-EGFP (T6-EGFP) or EGFP alone (EGFP) transfected cells. Data were expressed as percent changes from the values before application of H2O2 (time 0). The fluorescence intensity was measured using the software SymPhoTime (version 5.0). Asterisk indicates significant difference between T6-EGFP and EGFP at the corresponding time point. n indicates the number of analyzed cells from four sets of transfection. E, percent changes in fluorescence intensity on the cell surface 3 min after application of AVP (100 nm) in HEK293 cells cotransfected with EGFP or TRPC6-EGFP (T6-EGFP) and V1R with and without pretreatment of PEG-catalase (250 units/ml for 30 min). See D for the approach for data analysis. Asterisk indicates significant difference between the indicated groups. n indicates the number of analyzed cells from four sets of transfection.

