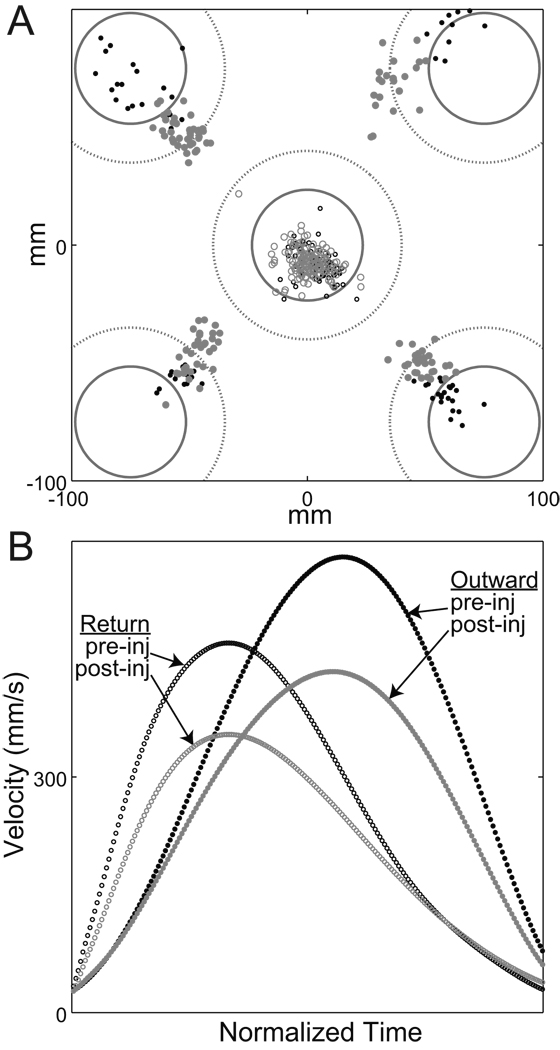
Figure 8.
(A) Return movements remained accurate following sGPi inactivation, despite frank hypometria in outward movements. End-point locations are plotted for individual outward movements (filled circles) and return movements (open circles) of pre-injection (black) and post-injection (gray) trials from one exemplar session (“b” in monkey H). Other conventions follow those of Fig. 2. (B): Pre- and post-injection return movements had lower peak velocities and longer deceleration phases compared with outward movements, consistent with the view that return movements were influenced strongly by feedback control. Mean tangential velocities are shown for the trials plotted in the top panel. To aid comparison, the durations of all velocity profiles have been normalized to one standard duration.

