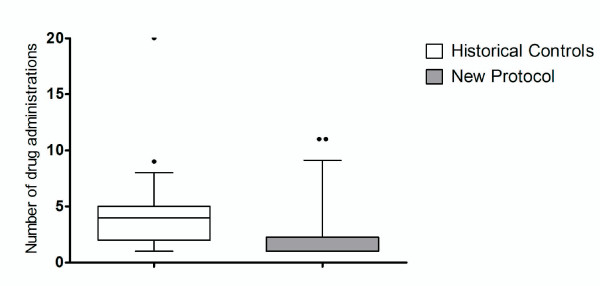
Figure 3.
Box and whiskers plot showing the number of total drug administration, including the initial sedation, comparing historical control patients to patients with the new sedation protocol. The whiskers are the 5th and 95th percentiles, the box the interquartile range, extreme outliers are filled circles and the median by the full line across the box.

