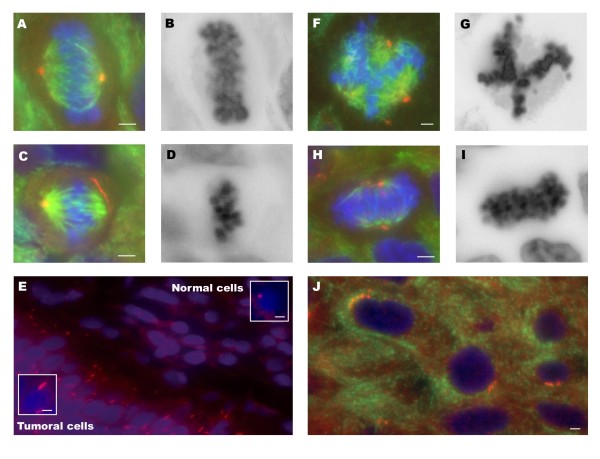
Figure 2.
Centrosome abnormalities. Immunolabeling was performed for γ-tubulin (red) and α and β-tubulin (green). DNA staining was performed with DAPI (blue). Black and white images correspond to DAPI reverse staining. (A-B) Normal/bipolar spindle. (C-D) Bipolar metaphase with string-like centrosome. (E) Tumour cells with abnormally long centrosomes, close to the adjacent normal urothelium. (F-G) Multipolar spindle. (H-I) Pseudo-bipolar metaphase. (J) Tumour cells with supernumerary centrosomes. Scale bar, 3 μm.

