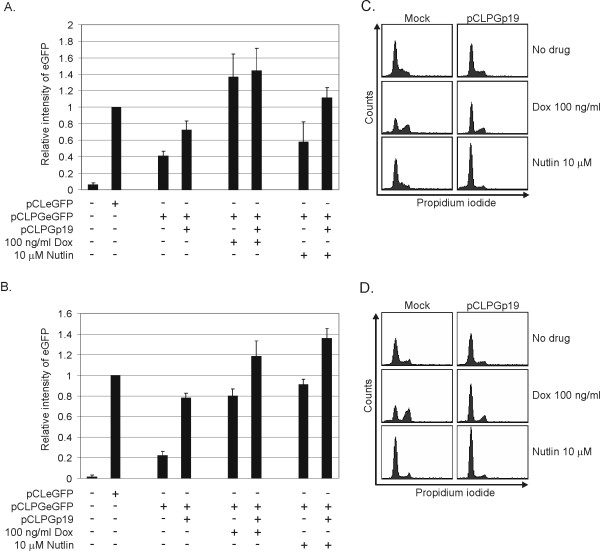
Figure 6.
Induction of endogenous p53 activity by combined gene and drug therapy. Cells were transduced with pCLeGFP as a control or the p53-responsive retroviral reporter pCLPGeGFP and selected for G418 resistance. For the assays, the B16 (A) or C6 (B) reporter cells were either mock transduced or transduced with pCLPGp19, replated in 6-well dishes and then treated with drug as indicated. The following day, cells were harvested for flow cytometric analysis of eGFP expression. The mean eGFP intensity was determined by the FACS software and the value for pCLeGFP used for normalization. Shown is the average and standard deviation of duplicate samples performed in three independent experiments. Cell cycle analysis (C and D) was performed in parallel with the assays shown in A and B.

