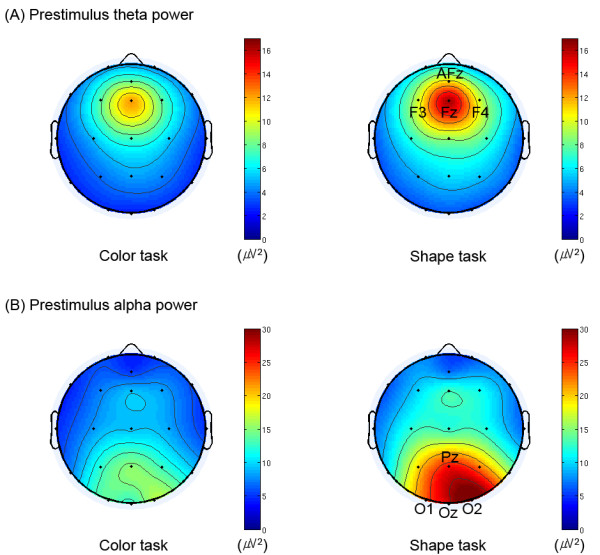
Figure 1.

Grand-averaged topographies of (A) prestimulus theta and (B) prestimulus alpha power for both tasks. These topographical distributions were computed by averaging the mean power at subjects' individual alpha and theta frequencies over the time window from 300 to 50 ms prestimulus. Within this time window, individual alpha and theta frequencies were obtained from the frequencies showing maximal power of each task in alpha band on the electrode Oz and in theta band on the electrode Fz, respectively. Note the differences in prestimulus alpha power around the posterior region (including the electrodes Pz, O1, Oz and O2), and those of prestimulus theta power around the anterior region (including the electrodes AFz, F3, Fz and F4) between the two tasks. All views are from the vertex, and the upside is nasal. Color bars indicate scales of the power (μV2) of oscillatory activity.
