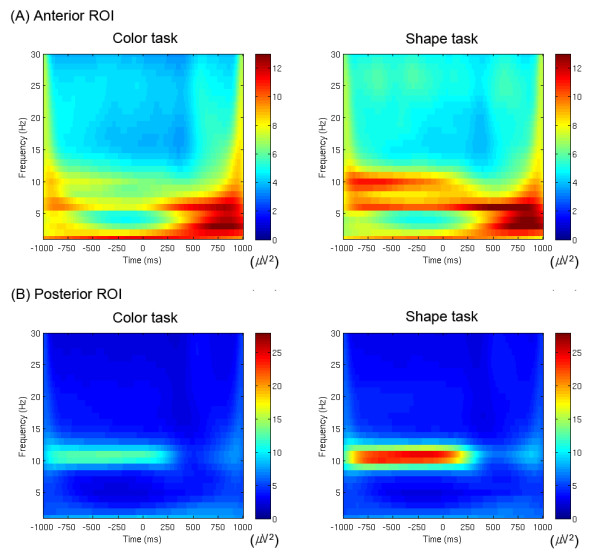
Figure 2.

Grand-averaged time-frequency representations of total power of oscillatory activity (1-30 Hz) on (A) the anterior ROI and (B) the posterior ROI for both tasks. Stimuli were presented from 0 to 500 ms. Color bars indicate scales of the power (μV2). Note the alpha activity (about 10 Hz) on the posterior ROI (averaged across the electrodes Pz, O1, Oz and O2) and the theta activity (about 6 Hz) on the anterior ROI (averaged across the electrodes AFz, F3, Fz and F4), and compare the differences between the two tasks, particularly before stimulus onset.
