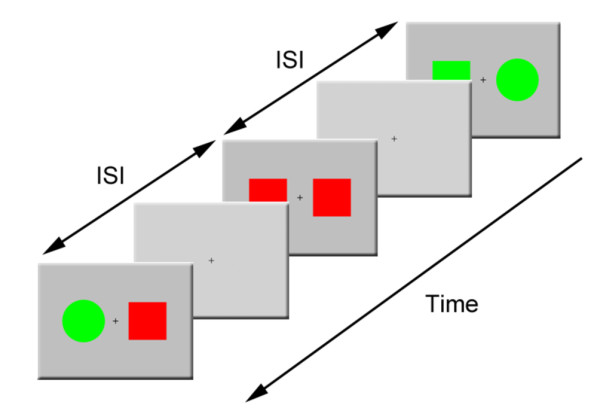
Figure 3.

A task flow diagram of sample stimuli and the ISIs. Two stimuli randomly drawn from a set of red or green circles or squares were presented bilaterally against a light-gray background on a computer monitor. Stimulus presentation was followed by a fixation cross presented during every ISI. The ISIs ranged randomly from 1500 to 2500 ms.
