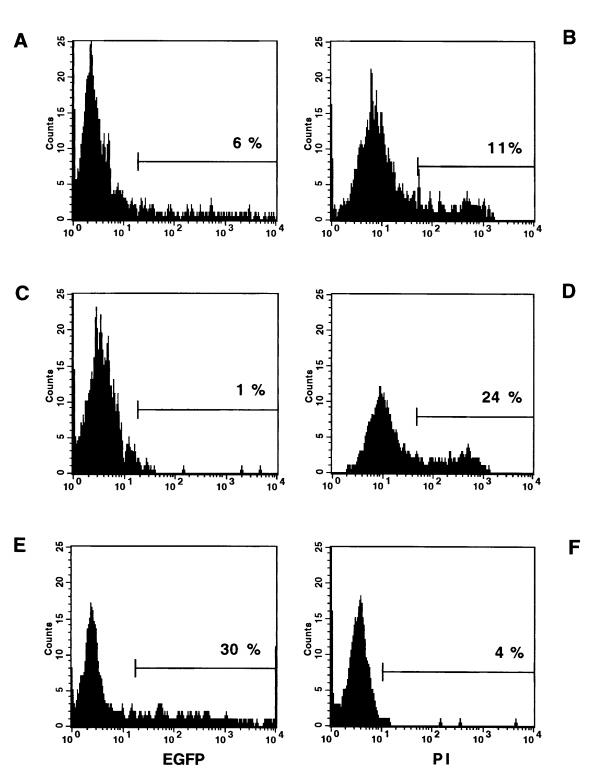
Figure 2.
Representative results of flow cytometric analysis of transfected rat hepatic stellate cells and rat myofibroblasts in comparison to NIH/3T3 cells using FuGENE™6 vehicle. For this experiment rHSCs, rMFBs and NIH/3T3 cells were transfected 2 days after seeding with 2 μg reporter plasmid complexed with 5 μl FuGENE™6. FACS analysis was performed 48 hours after transfection. Cultured cells were trypsinized under standard conditions and flow cytometric measurements were performed immediately after collection of cells. Fluorescence signals were recorded with a flow cytometer FACS-Calibur (Becton Dickinson, Sparks, MD) using a 488 nm excitation and a 530 ± 30 nm emission fluorescence filter for enhanced green fluorescence protein (EGFP) and a 630 ± 11 nm emission fluorescence filter for propidium iodide (PI), respectively. Data were acquired and analyzed with the CellQuest™ software version 3.1 (Becton Dickinson). Histograms of fluorescence intensities in EGFP (A, C, E) and PI (B, D, F) channels are shown for rHSC (A, B), rMFB (C, D) and reporter cell line NIH/3T3 (E, F), respectively. To establish background for fluorescence and to set gates for data acquisition, mock-transfected cells (not shown) were used. Mean fluorescence intensity was used to calculate levels of EGFP expression. Cells that took up PI were deemed nonviable. Nontransfected cells did not show fluorescence in EGFP channel.

