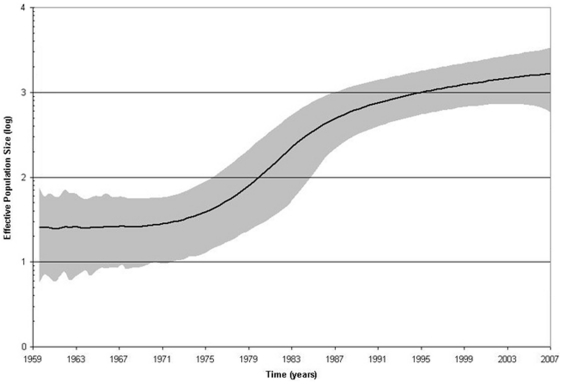
Figure 7. Bayesian skyline plot showing the epidemic history estimated from the Nigerian HBV genotype E dataset.
The middle line is the median estimate of effective population size (log10) and the grey area shows the 95% highest posterior density intervals for this estimate. The most recent time is the time of collection for the most recently collected sequences (2007) and the oldest time shown is the lower limit of the 95% highest posterior probability density for the root height for all the sequences (1959).

