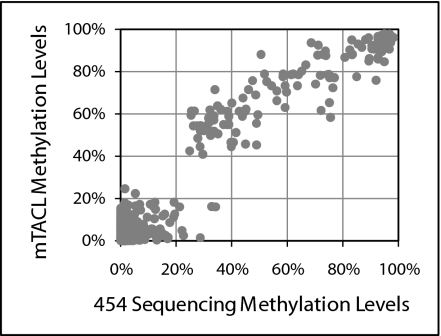
Fig. 2.
Comparison of the state of methylation between mTACL and 454 sequencing. Each point represents data from a single CpG. The y axis shows the level of methylation of a particular CpG as determined by 454 sequencing of bisulfate-treated DNA, and the x axis shows the methylation level determined by mTACL.

