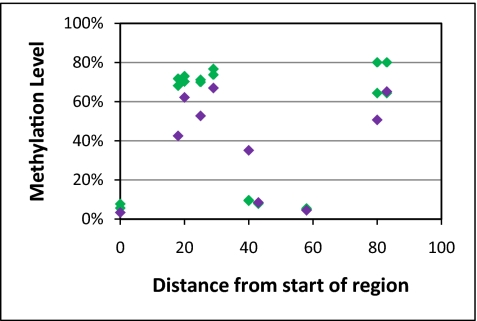
Fig. 4.
Methylation levels can change dramatically over small distances. The x axis indicates distance from the first CpG in the region of interest, and the y axis the estimated methylation levels. The green diamonds represent the two mTACL repeats of NA06991; purple diamonds show the methylation values obtained from 454 sequencing data.

