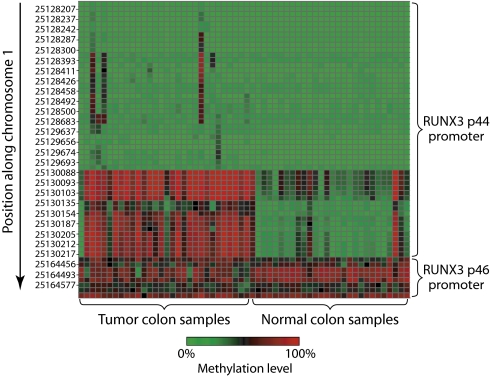
Fig. 5.
Differential tumor and normal methylation in RUNX3. Heat map of the levels of methylation in tumor and normal samples for RUNX3 (green is low methylation, red is high). CpGs are shown sorted by position along the y axis, and samples are shown along the x axis. CpGs for two promoters of RUNX3 are displayed.

