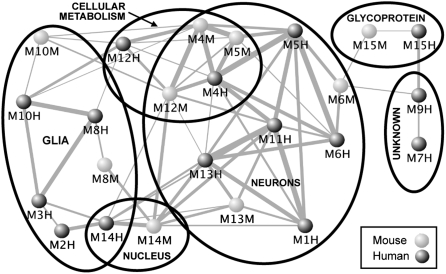
Fig. 2.
There is high module overlap both within and between-species. Furthermore, modules with significant overlap tend also to have similar functional characterizations (also see Table 1 and Table S2). Dots correspond to modules from the mouse (light) and human (dark) networks. Line widths are scaled based on the significance of overlap between corresponding modules. Position of the dots and length of the lines are arbitrary to aid visualization.

