Fig. 4.
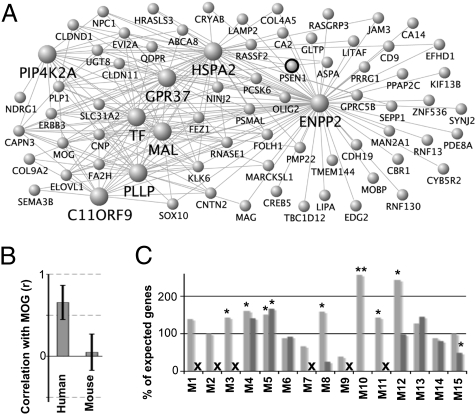
Multiple glial cell types show disease-relevant, human-specific properties. (A) PSEN1 has high connectivity in M2h (the human oligodendrocyte module). Labeling is as in Fig 3A. (B) PSEN1 and MOG show strong positive correlation in all human data sets, but minimal correlation in any mouse data set. Error bars represent SD of correlation values in each network. (C) Most modules contain excess dementia-related genes, with microglial modules showing the greatest between-species differences. The x axis corresponds to mouse and human module labels (“X” indicates no mouse module). The y axis corresponds to the percent of observed dementia DGs relative to the number expected by chance (100%). *P < 0.05; **P < 0.001.

