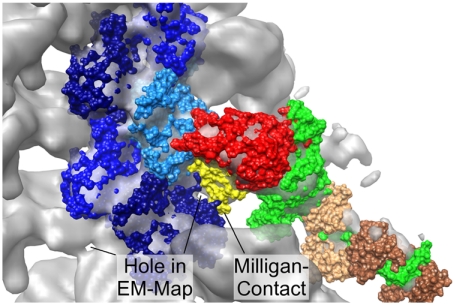
Fig. 7.
Surface representation of the model 1 and the EM map at 13-Å resolution (orientation: at right angles to the helix axis). The cutoff level of the map is chosen in order to show the hole in the density surrounded by regions of AC1 that bind to S1. Color code as in Fig. 1B, ELC in light brown, RLC in dark brown. Generated with Chimera (11).

