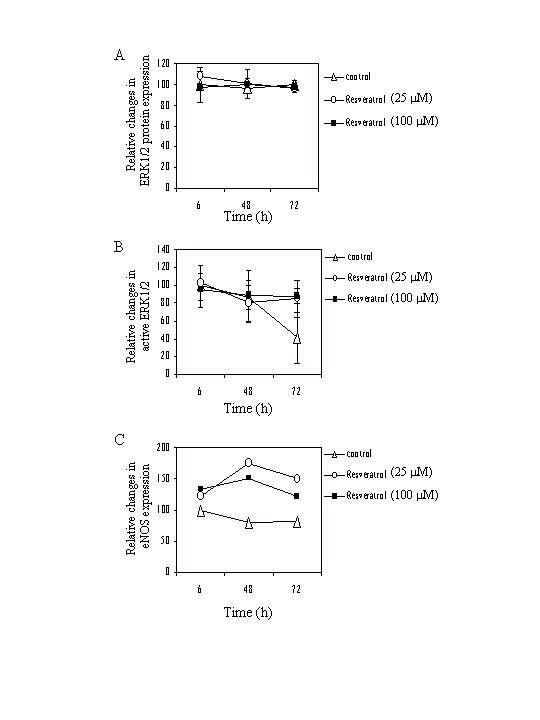
Figure 6.

Time-dependent relative changes in expression of total ERK1/2, active ERK1/2, and eNOS. Intensity of signals corresponding to total ERK1/2 (panel A), active ERK1/2 (panel B), and eNOS (panel C) obtained by western blot analysis, similar to those shown in Figure 5, was quantified by actin-adjusted image analysis and plotted as a function of time of treatment with 25 μM and 100 μM resveratrol. The control value at 6 h was set at 100. The results represent the average of two experiments, each analyzed in duplicate or triplicate.
