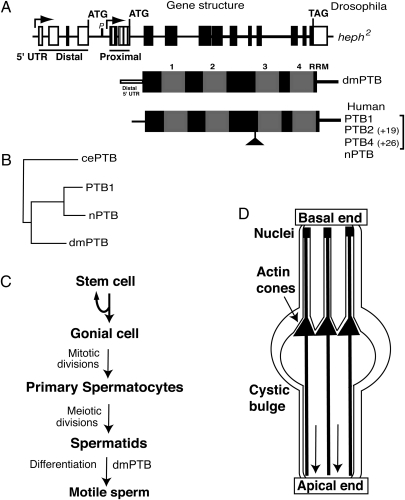
Fig. 5.
Schematic representations of the dmPTB gene, PTB protein structures, and spermatogenesis. (A) dmPTB gene structure. Arrows represent two transcription start sites. Distal and proximal 5′ UTRs are shown. Exons are rectangles, and lines are introns. The RNA-binding domain of dmPTB is identical for both transcript sets. Protein variants for Drosophila (dmPTB) and human PTB (PTB1, -2, -4, and nPTB) are shown; the PTB variants are also referred to as PTBP1, where 1, 2, and 4 isoforms are labeled as c, b, and a, respectively, and nPTB is referred to as PTBP2 (National Center for Biotechnology Information database). (B) Phylogenetic sequence divergence between dmPTB and the Caenorhabditis elegans (cePTB) and human PTB variants (PTB1 and nPTB) using ClustalW alignment. (C) Schematic of spermatogenesis. The first identifiable defect (spermatid individualization) in the dmPTB mutants is indicated. (D) Spermatid individualization. The IC of actin cones (solid triangles) migrates from the basal end to the apical end (shown by the direction of the downward arrows). Cystic bulge near the migrating actin cone of the IC is shown. Only 3 of the 64 spermatids are shown, for clarity. During the individualization process each axoneme (solid lines from top to bottom) is encased in its own membrane, removing the organelles and cytoplasm and severing interspermatid connections. Sperm nuclei are indicated. Modified from refs. 20 and 21.

