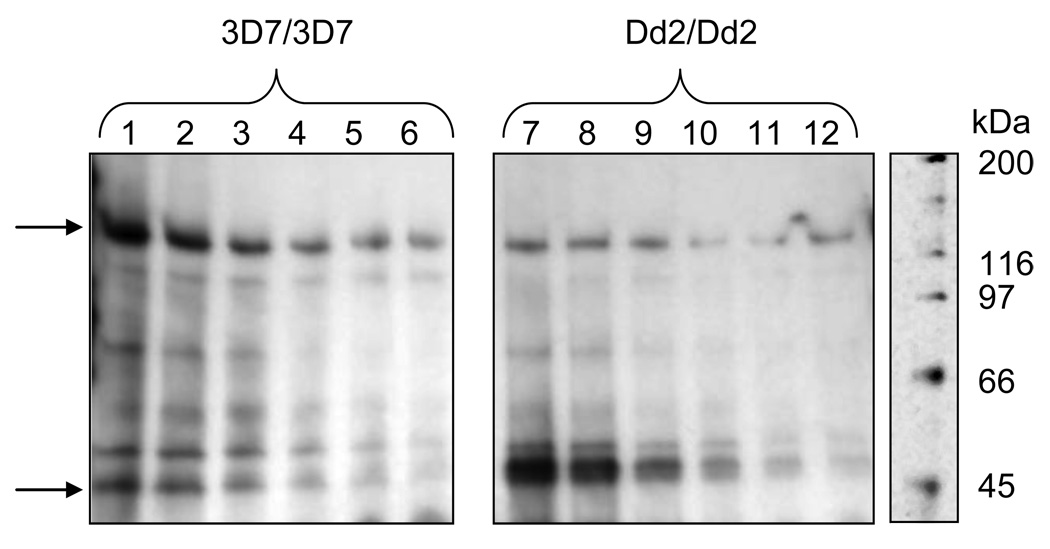
Fig. 2.
PfMDR1 and PfCRT compete for AzBCQ photolabeling in isoform specific fashion. Equivalent amounts of purified 3D7 PfCRT and 3D7 PfMDR1 PL protein (left panel, lanes 1 – 6) or Dd2 PfCRT and Dd2 PfMDR1 PL protein (right panel, lanes 7 – 12) were mixed and the drug competition assay was performed exactly as in Fig. 1, but using 5.0 nmoles AzBCQ (100 µM final concentration). Note the CQ IC50 does not change for either Dd2 PfMDR1 or Dd2 PfCRT when they are mixed together (Fig. 2) but that the CQ IC50 for 3D7 PfMDR1 drops by nearly a factor of 2 when it is mixed with equimolar 3D7 PfCRT (see text). The reactions were run on a 4–15% Tris-HCl gradient gel (Bio-Rad), to better resolve both high molecular mass protein (PfMDR1, upper arrow) and medium molecular mass protein (PfCRT, lower arrow) on the same gel. Gels were run, transferred, and blotted the same as in Fig 1. Streptavidin-HRP detection of 3D7/3D7 (left) and Dd2/Dd2 (right) AzBCQ-labelled PfMDR1/PfCRT PL proteins vs. CQ competition: lanes 1 & 7- no CQ; lanes 2 – 6 (left) and 8 – 12 (right); 16-, 32-, 48-, 64- and 80-fold molar excess (1.6 mM, 3.2 mM, 4.8 mM, 6.4 mM, and 8.0 mM final concentration) of CQ relative to AzBCQ respectively.

