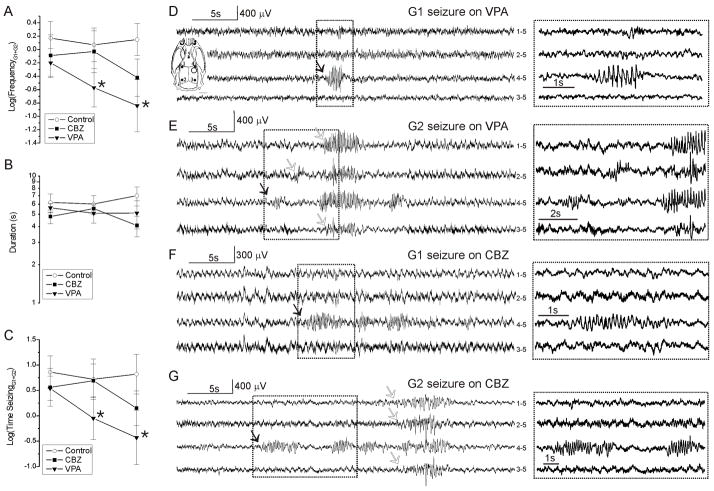
Figure 10. Comparison of frotal-lobe seizure frequency, duration and time spent seizing in untreated, CBZ-treated and VPA-treated rats.
A) The mean logarithms of the frequencies of neocortical (G1+G2) seizures decreased progressively in VPA treated rats (filled triangles; N=8 *p<0.05 compared to week 4, paired t-test) but not in untreated controls (hollow circles; N=11) or CBZ-treated (filled squares; N=8) rats. B) The mean logarithms of the duration of neocortical seizure in A is similar among treatments and stable over the course of the study. C) The times spent in neocortical seizure in A parallels seizure frequency, and decreases progressively in VPA treated rats (*p<0.05 compared to week 4, paired t-test) but not in untreated controls or CBZ-treated rats. D–G) Representative examples of G1 and G2 seizures coincident to behavioral arrest and detected by ECoG during week 5 treatment with CBZ or VPA. Filled arrows indicate seizure onset. Hollow arrows indicate seizure spread. Boxed regions are shown at higher temporal resolution at right. Inset in D represents the schematic of the locations of the five epidural ECoG electrodes (filled circles) and of the injury site (hollow circle) in respect to the rat skull for all ECoG recordings shown in D–G. Throughout the panels, numbers next to each ECoG trace indicate the electrodes by which the trace is recorded, and its reference.

