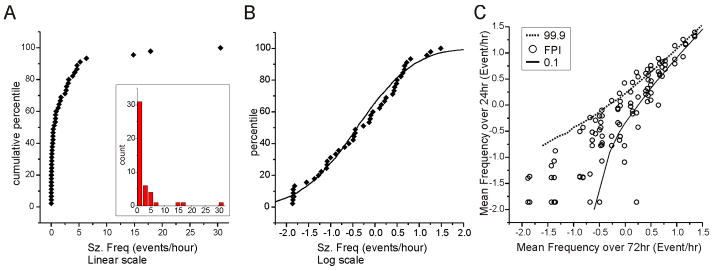
Figure 2. Variability of epilepsy 1 month after injury.
A) Cumulative frequency histogram and frequency histogram (inset) of the distribution of seizure frequencies observed in 45 epileptic rats 4 weeks after rpFPI. B) Cumulative histogram of the data from (A) after logarithmic transformation (filled symbols). Solid line shows a cumulative histogram of 5000 random numbers drawn from a log-normal distribution (mean= −0.4; standard deviation= 1.0). Note the good correspondence of the experimental data to a log-normal distribution for all but the lowest frequency values. C) Comparison of the measurement-to-measurement variation in experimentally observed seizure frequencies (circles) with the computed variation expected for seizures occurring randomly with stationary mean frequencies ranging from 0.025–32 events/hr (lines). The lines delimit the 0.1th (solid) and 99.9th (dotted) percentiles of the distribution of 24-hr seizure frequencies determined in Monte-Carlo simulations (105 iterations). Experimental data are post-injury week 4 seizure frequencies determined in 3 sequential 24hr recordings each from 36 rats. For each rat, the 3 individual frequencies are plotted against their mean. Note that 28% of the experimentally determined values lie outside of the lines that would enclose 99.8% of the data if FPI-induced seizures occurred randomly with a stationary seizure frequency.

