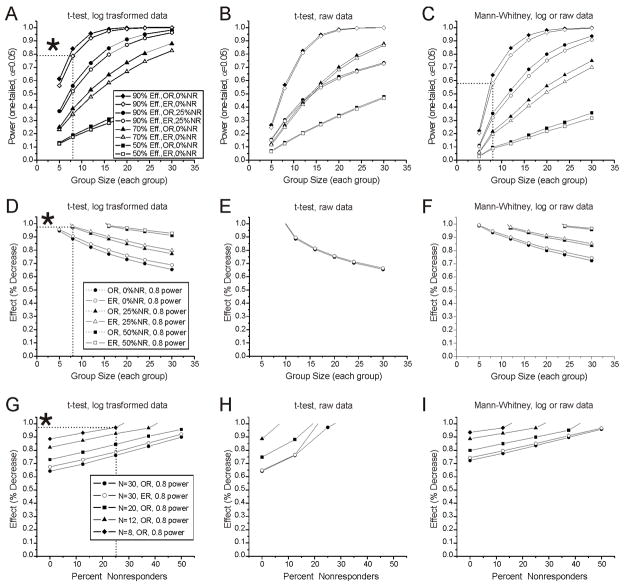
Figure 4. Effect of measurement-to-measurement variability and non-responders on statistical power to detect decreases in seizure frequency in independent-groups comparisons (Table 1, Ia) conducted using Mann-Whitney U or unpaired t-test.
A–C) Power to detect 50%, 70% and 90% decreases in seizure frequencies drawn from observed (OR) and 50% extended (ER) frequency ranges, when non-responders (NR) comprise 0% or 25% (90% decrease, only) of the indicated experimental groups. A) Power as a function of group size for logarithmically transformed frequency data analyzed with t-test. B) Power as a function of group size for raw frequency data analyzed with t-test. C) Power as a function of group size for both logarithmically transformed and raw frequency data analyzed with Mann-Whitney. Note that the Mann-Whitney test returns identical results (overlapped) for raw and logarithmically transformed data. Legend in A refers to A–C. D–F) Group sizes required to provide 0.8 power to detect the indicated reductions in seizure frequency in groups containing 0%, 25% and 50% NR when logarithmically transformed (D) or raw (E) frequency data are analyzed using a t-test, or when either raw or transformed data are assessed with the Mann-Whitney test (F). Legend in D refers to D–F. G–I) Effect sizes detectable with 0.8 power as a function of the percentage of NR in independent groups of 8, 12, 20 and 30 subjects each when logarithmically transformed (G) or raw (H) frequency data are analyzed using t-test, or when either raw or transformed data are assessed with Mann-Whitney test (I). Legend in G refers to G–I. Throughout, asterisks in A, D, and G highlight the higher performance of the t-test and log transformed data over the Mann-Whitney U test. Note that the statistical power of independent groups analyses are minimally affected by a 50% increase in the range of data variation (ER), but is markedly diminished by non-responding subjects. Drug effects refer to responding animals, not to group averages. In panels D–I missing data points did not reach power of 0.8.

