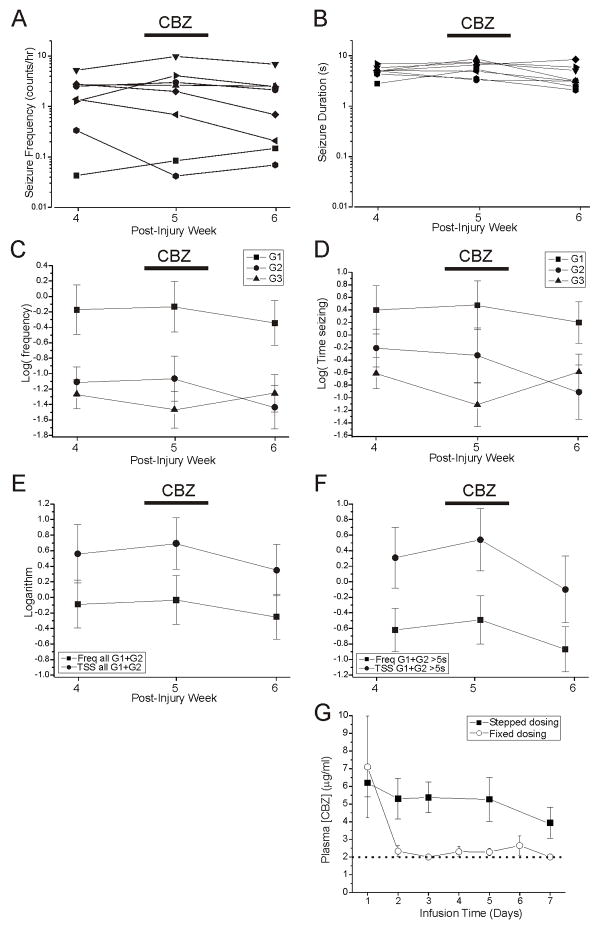
Figure 7. Lack of effect of carbamazepine on rpFPI-induced PTE 5 weeks after injury.
A) Plots of mean seizure frequency in 8 individual rats before (week 4), during (week 5) and after (week 6) administration of CBZ via s.cu. osmotic minipump. B) Plots of mean duration of all seizures in the same rats before, during and after CBZ administration. Data in A–B are on a logarithmic scale. The mean logarithms of the frequencies of G1, G2 and G3 seizures recorded before during and after CBZ treatment is shown in C, while the mean logarithm of the time spent seizing is shown for each seizure type in D. E) Activity of the neocortical focus as demonstrated by the mean logarithms of the frequencies (Freq) and times spent in G1 and G2 seizures (TSS) before during and after CBZ treatment. Displayed data include all (longer than 0.8s) detectable seizures. F) Activity of the neocortical focus demonstrated as in (E), but including only seizures longer than 5s. Note that the analyses displayed in (E) and (F) are similar but the greater number of events included in (E) may result in enhanced sensitivity. G) The results of pharmacokinetic pilot studies of CBZ are shown. The 3-dose stepped dosing protocol by osmotic minipump used in this study (4 → 8 → 12 mg*kg−1*day−1; filled squares) maintained stable blood levels of CBZ over a week (N=6). Conversely, infusion of CBZ at a fixed dose (4mg*kg−1*day−1; hollow circles) could not maintain therapeutic blood levels (N=7). Dotted line indicates the detection threshold for CBZ.

