
Figure 1.
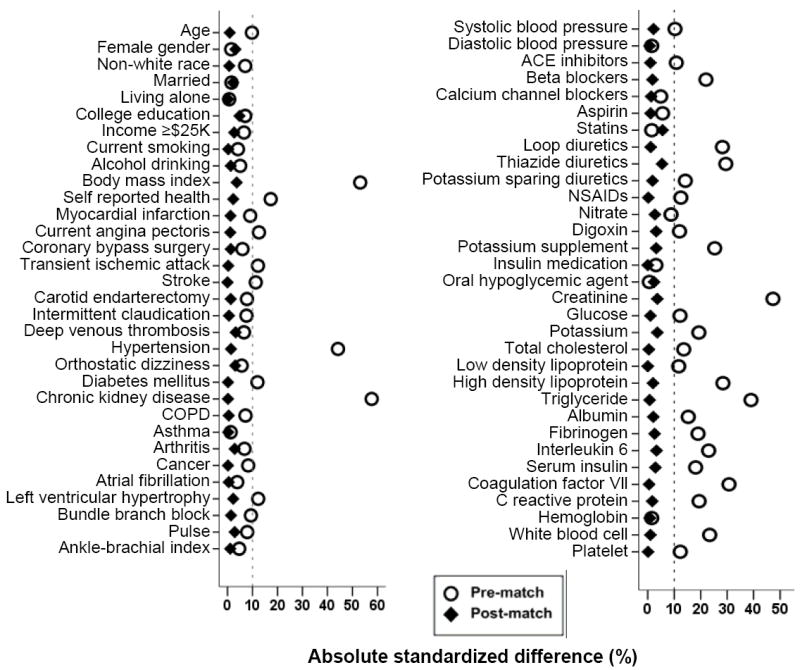
Love plots for absolute standardized differences for covariates between participants with and without hyperuricemia (defined as serum uric acid levels ≥6mg/dL for women and ≥7mg/dL for men), before and after propensity score matching (ACE=angiotensin-converting enzyme, COPD =chronic obstructive pulmonary disease, NSAID=non-steroidal anti inflammatory drug)