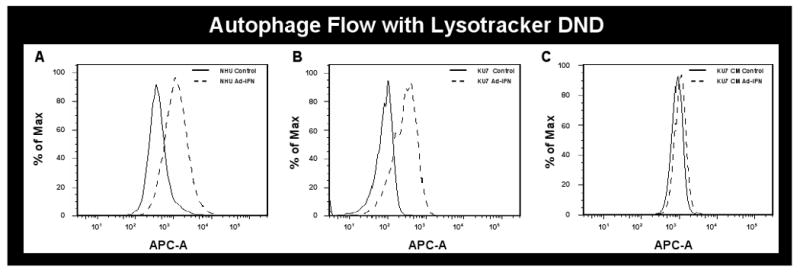
Fig.3.

Autophagy is produced as measured with LysoTracker Red DND-99 and flow cytometry. Ad-IFNα infected cells were labeled with DND and analyzed on channel APC-A. Representative histograms are displayed. Data overlay was done by FlowJO. On the y axis is the % Max (the cell count in each bin divided by the cell count in the bin that contained the largest number of cells), and the x axis is the fluorescence intensity in log scale. Both normal and KU7 cancer cells show a shift to the right after Ad-IFNα treatment as a measure of autophagy (A and B, respectively) whereas none is seen in the KU7 cells exposed to conditioned medium obtained 72hr after KU7 cell exposure to Ad-IFNα (KU7 CM-Ad-IFNα) compared to cells treated with KU7 conditioned medium from untreated cells at the same time point (KU7 CM-control).
