

Summary
We have developed a somatic cell gene delivery mouse model of melanoma that allows for the rapid validation of genetic alterations identified in this disease. A major advantage of this system is the ability to model the multi-step process of carcinogenesis in immune-competent mice without the generation and cross breeding of multiple strains. We have used this model to evaluate the role of RAS isoforms in melanoma initiation in the context of conditional Ink4a/Arf loss. Mice expressing the TVA receptor specifically in melanocytes under control of the dopachrome tautomerase (DCT) promoter were crossed to Ink4a/Arflox/lox mice and newborn DCT-TVA/Ink4a/Arflox/lox mice were injected with retroviruses containing activated KRAS, NRAS and/or Cre-recombinase. No mice injected with viruses containing KRAS and Cre or NRAS alone developed tumors; however, more than one-third of DCT-TVA/Ink4a/Arflox/lox mice injected with NRAS and Cre viruses developed melanoma and two-thirds developed melanoma when NRAS and Cre expression was linked.
Keywords: Somatic cell gene delivery, melanocytes, Ink4a/Arf, Ras, Melanoma
Introduction
While melanoma accounts for only 4% of all skin cancers, it is responsible for ~80% of skin cancer deaths (Jemal et al., 2009). If detected early, the disease is easily treated, however, once the disease has metastasized it is largely refractory to conventional therapies and is associated with a high mortality rate (Ahmed, 1997). The five-year survival rate in patients diagnosed with advanced stages of the disease has remained at less than 15% for decades (Jemal et al., 2009).
Molecular analysis of familial and sporadic melanomas has identified several genomic loci implicated in the genesis and progression of this disease (Chin, 2006). With mutually exclusive mutations in RAS and BRAF (Davies et al., 2002), the mitogen-activated protein kinase (MAPK) signaling pathway is constitutively activated in over 85% of malignant melanomas, indicating the importance of this pathway in melanoma development. Mutations in NRAS or KRAS, whose protein products constitutively activate MAPK signaling (Lewis et al., 1998), have been detected in approximately 20% of human melanomas (Barbacid, 1990, Reifenberger et al., 2004, Shukla et al., 1989) while activating mutations in BRAF, which also activate MAPK signaling, are found in ~65% of malignant melanomas (Davies et al., 2002). Melanomas with BRAF mutations often show PTEN loss and/or AKT amplification resulting in constitutive activation of the phosphatidylinositol-3-kinase (PI3K) and AKT signaling pathway.
Activating mutations in cyclin-dependent kinase 4 (CDK4) (Pho, 2006) and loss of the cyclin-dependent kinase inhibitor-2A (CDKN2A) locus have been identified as melanoma susceptibility genes (Haluska and Hodi, 1998). The CDKN2A locus encodes two tumor suppressor proteins: Inhibitor of cyclin-dependent kinase 4A (p16INK4a) and alternate reading frame (p14ARF, p19Arf in mice). In both familial and sporadic melanomas, exon 2, which is common to both p16INK4a and p14ARF, is frequently deleted (Castellano and Parmiani, 1999). This deletion disrupts both the RB and p53 pathways and may explain why p53 is found mutated in only a small percentage of these tumors (Meier et al., 1998).
Conditional expression of BRafV600E specifically in mouse melanocytes leads to benign melanocytic hyperplasias (Dankort et al., 2009, Goel et al., 2009) and tumor formation in ~50% of the mice with a median latency of 12 months (Dhomen et al., 2009). Loss of Ink4a or both Ink4a/Arf increased the penetrance and decreased the latency of tumor formation (Dhomen et al., 2009, Goel et al., 2009). Conditional Pten gene silencing in combination with BRafV600E expression specifically in melanocytes leads to metastatic melanoma in all of the mice with a median latency of 50 days (Dankort et al., 2009). Tyrosinase-driven expression of mutant HRasG12V and NRasQ61K in the melanocytes of Ink4a/Arf-deficient mice results in the formation of melanoma in 50% or 90% of the mice, respectively, by 6 months of age thereby confirming a role for HRas and NRas in melanoma formation (Ackermann et al., 2005, Chin et al., 1997). In addition, an inducible HRasG12V melanoma mouse model null for the tumor suppressors Ink4a/Arf demonstrated the importance of HRasG12V in melanoma maintenance (Chin et al., 1999).
Although several molecular abnormalities have been identified in human melanoma, validation of their contribution to melanoma formation, progression and/or metastasis has been limited by the time and effort required to generate new strains of mice. A retroviral-based somatic cell gene transfer method has been designed to overcome this limitation (Fisher et al., 1999). This method is based on the RCAS/TVA retroviral vector system that allows for tissue- and cell-specific targeted infection of mammalian cells through ectopic expression of the viral receptor. This system utilizes a viral vector, RCASBP(A), derived from the avian leukosis virus (ALV) (Federspiel and Hughes, 1997). The receptor for RCASBP(A) is encoded by the TVA gene and is normally expressed in avian cells; infection with ALV results in stable integration of the virus into the genome of replicating cells. In mammalian cells that express TVA, the viral vector is capable of stably integrating into the DNA and expressing the inserted experimental gene, but the virus is replication-defective, which allows for multiple rounds of infection (Federspiel et al., 1994). The ability of TVA-expressing mammalian cells to be infected by multiple ALV-derived viruses allows efficient modeling of human melanoma because multiple oncogenic alterations can be introduced into the same cell or animal without the expense or time associated with creating multiple strains of transgenic mice. The dopachrome tautomerase (DCT) promoter, also known as tyrosinase-related protein 2 (TRP2), was chosen to drive expression of the viral receptor TVA specifically in melanocytes since this gene is expressed early in melanocyte development when the cells are mitotically active (Steel et al., 1992). The DCT-TVA transgenic line is capable of conferring sensitivity to infection by RCAS viruses in neural tube cultures derived from these mice as DCT is also expressed in neural crest cell precursors in the developing neural tube (Dunn et al., 2000, Dunn et al., 2005). In utero infection by RCAS viruses containing lacZ and tyrosinase has also been demonstrated (Dunn et al., 2001).
To model human melanoma using the RCAS/TVA system, we generated DCT-TVA/Ink4a/Arf lox/lox mice and delivered viruses containing NRASQ61R or KRASG12D and Cre-recombinase postnatally by subcutaneous injection of viral producing cells to somatic melanocytes expressing TVA. While no mice injected with viruses containing KRAS and Cre or NRAS alone developed tumors, the combination of NRASQ61R and Cre resulted in tumor formation in 36% of the mice by 14 weeks. Delivery of a virus in which NRASQ61R and Cre expression is linked resulted in tumor formation in 63% of TVA positive mice. Short term cultures from the primary tumors were established and these cells were tumorigenic in DCT-TVA/Ink4a/Arf lox/lox mice. Further passage of these tumor cells in vivo resulted in reduced latency and development of spontaneous metastases. In this model, tumors evolve from gene mutations in developmentally normal somatic cells in the context of an unaltered microenvironment and therefore closely mimic the human disease. Using this system, newly identified genes can be rapidly validated for their role(s) in melanoma genesis, progression, and maintenance.
Results
Generation of DCT-TVA/Ink4a/Arf lox/lox mice
To model human melanoma using the RCAS/TVA somatic cell gene delivery system (Supplementary Figure 1), DCT-TVA mice were intercrossed to mice carrying a conditional Ink4a/Arf allele, Ink4a/Arf lox (Aguirre et al., 2003), to generate DCT-TVA/Ink4a/Arf lox/lox mice. The lox sites flank exons 2 and 3 of this locus such that Cre-mediated excision eliminates both p16Ink4a and p19Arf. In the absence of Cre, homozygous Ink4a/Arf lox/lox mice and cells isolated from these mice express normal levels of p16Ink4a and p19Arf. Infection of mouse embryonic fibroblasts (MEFs) isolated from these animals with a retrovirus expressing Cre resulted in loss of expression of both p16Ink4a and p19Arf and caused the cells to become immortal (Aguirre et al., 2003).
Optimization of viral infection in the skin of DCT-TVA/Ink4a/Arf lox/lox mice
To determine the optimal time for in vivo viral delivery, we utilized confocal/multi-photon and whole body intravital imaging to monitor gene expression and the efficiency of retroviral gene delivery. Newborn DCT-TVA/Ink4a/Arf lox/lox mice were injected subcutaneously with RCASBP(A)GFP infected avian fibroblast DF-1 producer cells (Supplementary Figure 2a). While either viral supernatant or producer cells can be used, it has been demonstrated that the use of viral producer cells results in greater infection efficiency (Federspiel et al., 1994). Viral producer cells stay at the site of injection and continuously produce virus until they are cleared, usually within a week after injection (Supplementary Figure 2). The virus that is produced buds off the membrane of the avian cells and can infect nearby cells that express TVA, which in this model is driven by the DCT promoter. Throughout the text we refer to injection of viral producing cells and virus synonymously. Immediately following injection, GFP expression within the injected DF-1 cells was visualized by intravital imaging (Supplementary Figure 2b). Three weeks post injection, GFP expression was evaluated in TVA negative (Supplementary Figure 2c) and DCT-TVA positive mice (Supplementary Figure 2d) by confocal intravital imaging. GFP expression from the injected DF-1 cells was detected in all animals immediately following injection (due to the presence of the GFP expressing DF-1 cells), but after three weeks GFP expression was only detected in DCT-TVA positive animals (compare Supplementary Figures 2c and d). Whole body fluorescence intravital imaging using the FluorVivo imaging system revealed that the DF-1 cells are cleared by the animals within one week following injection (Supplementary Figure 2e-j). Therefore, GFP expression detected after three weeks is the result of viral infection of DCT-TVA positive target cells. The lack of expression observed in DCT-TVA negative animals demonstrates the specificity of infection to only those cells expressing TVA. Importantly, no tumors were observed in mice injected with DF-1 cells containing RCASBP(A)GFP (Table 1), which demonstrates that viral integration alone is not sufficient for the development of melanoma in this model.
Table 1.
Summary of tumor formation in DCT-TVA/Ink4a/Arf lox/lox mice.
| Gene(s) delivered | TVA status | Ink4a/Arf status | Incidence | Mean survival (days) |
|---|---|---|---|---|
| GFP | Positive | +/+ | 0/17 | N/A |
| NRASQ61R | Positive | +/+ | 0/15 | N/A |
| Cre | Positive | −/− | 0/20 | N/A |
| KRASG12D + Cre | Positive | −/− | 0/30 | N/A |
| NRASQ61R + Cre | Positive | −/− | 8/22 | 43.3 ± 3.94 |
| NRASQ61R -IRES-Cre | Positive | −/− | 5/8 | 47.0 ± 4.30 |
| NRASQ61R + Cre | Negative | +/+ | 0/16 | N/A |
| NRASQ61R -IRES-Cre | Negative | +/+ | 0/8 | N/A |
Delivery of viruses containing activated NRAS and Cre, but not KRAS and Cre, results in tumor formation in DCT-TVA/Ink4a/Arf lox/lox mice
Newborn DCT-TVA/Ink4a/Arf lox/lox mice were injected subcutaneously with a virus containing NRASQ61R and/or a virus containing Cre, to inactivate both p16Ink4a and p19Arf specifically in melanocytes of these mice. We have previously shown that expression of mutant NRAS from these retroviruses efficiently transforms Ink4a/Arf-null melanocytes in vitro and induces tumors in nude mice (Whitwam et al., 2007). While TVA-negative;Ink4a/Arf lox/lox mice infected with both Cre and NRASQ61R viruses as well as DCT-TVA-postitive;Ink4a/Arf lox/lox mice infected with only Cre or NRASQ61R viruses remained tumor free for the duration of the study, 36% of the DCT-TVA-postitive;Ink4a/Arf lox/lox mice infected with both Cre and NRASQ61R viruses developed tumors at the site of injection, n = 22 (Figure 1 and Table 1). Several of these tumors were visible as early as 4 weeks post-infection with a mean latency of 43.3 ± 3.94. Both HA epitope tagged and non-tagged NRASQ61R viral constructs were used to infect DCT-TVA melanocytes in vivo. No difference in tumor incidence or phenotype was observed between the two groups suggesting that the HA tag did not interfere with NRAS function. The HA tag allows for easy distinction between virally delivered NRASQ61R and endogenous NRas in the tissue samples. We suspected that the incomplete penetrance observed was mainly due to a failure of co-expression of the two genes in the same target cell. To test this, we linked the expression of NRASQ61R and Cre using an internal ribosomal entry site (IRES) such that tumors would form after infection with only one virus. Subcutaneous injection of DCT-TVA/Ink4a/Arf lox/lox mice with a virus containing NRASQ61R-IRES-Cre resulted in tumor formation in 63% of TVA positive mice (Table 1). Tumors induced by expression of NRASQ61R-IRES-Cre were indistinguishable from tumors induced by separate delivery of NRASQ61R and Cre. A comprehensive histological and immunohistochemical evaluation of a representative tumor is shown in Supplementary Figure 3.
Figure 1. Kaplan-Meier percent survival curve.

DCT-TVA/Ink4a/Arf lox/lox mice were injected at birth with NRASQ61R and Cre viruses. For DCT-TVA negative mice n = 16 (dashed line) and for DCT-TVA-positive mice n = 22 (solid line), P = 0.00813. No tumors formed in DCT-TVA positive Ink4a/Arf lox/lox mice injected with KRASG12D and Cre viruses (n = 30), NRASQ61R viruses alone (n = 15), Cre viruses alone (n = 20), or GFP viruses alone (n = 17) (see Table 1).
KRAS mutations have been infrequently observed in human melanoma but the ability of mutant KRAS to initiate melanoma formation in vivo has not been evaluated (Barbacid, 1990, Reifenberger et al., 2004, Shukla et al., 1989). To test this, newborn DCT-TVA/Ink4a/Arf lox/lox mice were injected subcutaneously with a virus containing KRASG12D and a virus containing Cre. In sharp contrast to the results observed following injection with viruses containing NRASQ61R and Cre, no tumors formed in mice injected with viruses containing KRASG12D and Cre (Table 1). The lack of tumor formation is not due to deficient function since the activity of KRAS in the context of this virus has been previously confirmed (Robinson et al., 2010, Whitwam et al., 2007).
Characterization of tumors induced by NRAS and Cre expression in DCT-TVA/Ink4a/Arf lox/lox mice
In DCT-TVA/Ink4a/Arf lox/lox mice injected with both Cre and NRASQ61R viruses, tumors always appeared at the site of injection and typically only one tumor developed per injection site (Figure 2a); however, one mouse developed two tumors. Macroscopically, the tumors were amelanotic as a result of the albino FVB/n background and were highly vascular. Histological examination of the tumors from DCT-TVA/Ink4a/Arf lox/lox mice infected with both Cre and NRASQ61R viruses by a board-certified pathologist revealed malignant cells in the dermis with no noticeable involvement of the epidermis (Figure 2b). The tumors consisted primarily of short spindle cells exhibiting high grade nuclear features and prominent nucleoli (Figure 2b). Mitotic figures were abundant, and some tumors possessed giant cells with epitheliod features. Occasional neoplasms exhibited coagulative tumor necrosis and non-brisk inflammation. Expression of NRAS was detected by IHC for RAS (Figure 2c) and NRAS activity was detected by IHC for phosphorylated Erk (Figure 2d) and phosphorylated p70 S6 Kinase (Figure 2e). Expression of the proliferation marker Ki67 was also analyzed by IHC, and the majority of the cells were positive (Figure 2f). The melanocytic origin of these tumors was established by their immunoreactivity for S100 (Figure 2g) and a pan-melanoma cocktail consisting of antibodies to HMB-45, a premelanosomal glycoprotein gp100, and melanoma antigen recognized by T-cells-1 (MART-1). Both HMB-45 and MART-1 are highly specific for melanomas (Ohsie et al., 2008). The histological characteristics combined with S100, HMB-45, and MART-1 staining strongly support the melanocytic origin of these tumors.
Figure 2. Induction of melanoma in DCT-TVA/Ink4a/Arf lox/lox mice.

Mice were injected with NRASQ61R and Cre viruses at birth. (a) A representative mouse (age 42 days) with a tumor at the site of injection. (b) H&E stained tumor section. (c) IHC for RAS. (d) IHC for phosphorylated Erk (p-Erk) (e) IHC for phosphorylated p70 S6 kinase (p-S6K). (f) IHC for Ki67. (g) IHC for S100. (h) IHC for HMB-45 and MART-1 (pan-MEL). All sections were counterstained with hematoxylin. Scale bars represent 1.0 mm for (b) and 200 μm for (c-h).
All major organs of mice with tumors induced by viral delivery of both Cre and NRASQ61R viruses were thoroughly examined. In one animal, the tumor cells involved the brain (Supplementary Figure 4a-b) but this was likely due to direct extension since the tumor formed at the site of injection behind the ear and the tumor had invaded through the skull. This tumor was induced with NRASQ61R-HA and therefore virally delivered NRASQ61R could be detected by IHC for HA, which was more pronounced when the sections were not counterstained with hematoxylin (compare Supplementary Figure 4c and d). A high percentage of the tumor cells were positive for Ki67 (Supplementary Figure 4e-f) while few cells in the normal brain tissue were proliferative (Supplementary Figure 4h). Glial fibrillary acid protein (GFAP) is an intermediate filament protein normally expressed in the brain but not in melanoma and GFAP expression was absent in the tumor cells (Supplementary Figure 4g). A stark contrast in GFAP expression can be observed at the invading front of the tumor adjacent to normal brain (Supplementary Figure 4h). Expression of nestin, an intermediate filament protein and a marker of hair follicle and neural stem cells (Hoffman, 2007), was observed prominently in the tumor (Supplementary Figure 4i) while a few cells, presumably neural stem/progenitor cells, in the brain were also nestin positive (Supplementary Figure 4j).
NRASQ61R-Ink4a/Arf -/- tumor cells are tumorigneic in nude mice
Short term cultures were established from the primary tumors and expression of virally delivered NRASQ61R-HA in addition to Cre mediated loss of p19Arf was confirmed by Western blotting of cell extracts (Figure 3). It is important to note that the level of NRAS expressed from the virus was not significantly different than the level of endogenous NRas expression in control uninfected cells as detected using an NRAS specific antibody and quantitated using Image J (Supplementary Figure 5). The virally delivered NRAS can be distinguished from endogenous NRas by its higher molecular weight, which results from the HA epitope tag (Supplementary Figure 5). The level of endogenous NRas in the infected cells is reduced and this is likely the result of feedback inhibition. The activity of the virally delivered NRAS was also assessed by Western blot analysis of phosphorylated Erk, which was increased in the tumor samples compared with the non-transformed immortal melanoctyes (Figure 3).
Figure 3. Protein expression in explanted melanoma cells.
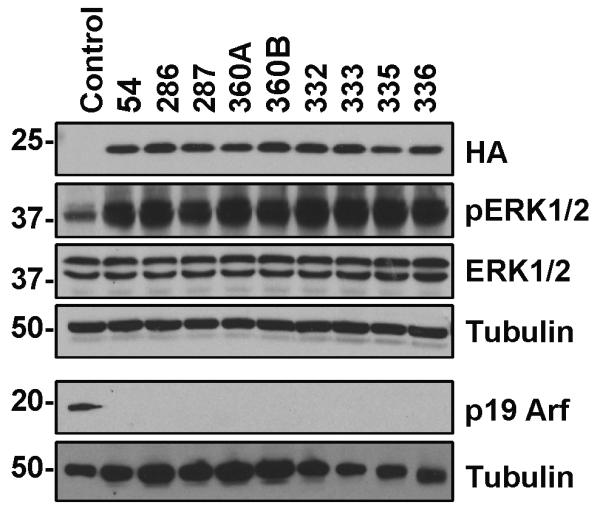
Expression of NRASQ61R-HA from nine different tumor samples (54, 286, 287, 360A, 360B, 332, 333, 335 and 336). The A and B designation indicates two separate tumors from the same mouse. Samples 54, 286, 287, and 360A and B were derived from tumors induced by injection of DCT-TVA/Ink4a/Arf lox/lox mice with viruses containing NRASQ61R and Cre while samples 332, 333, 335, and 336 were derived from subcutaneous injection of tumor cells into DCT-TVA/Ink4a/Arf lox/lox mice. The cells were lysed in SDS lysis buffer and separated on 4-20% gradient polyacrylamide gels. Virally delivered NRAS expression was detected with an antibody to the HA epitope tag on NRAS. NRAS activity was evaluated by blotting for phosphorylated ERK1/2 (p-ERK 1/2) and comparing the levels of total ERK 1/2 expression. Activity of Cre was evaluated by blotting for p19 Arf expression. D6-MEL immortal melanocytes were used as a negative control for HA expression and normal mouse astrocytes were used as a positive control for p19 Arf expression. The blots were re-probed with α-tubulin as a loading control.
The ability of the explanted cells to grow in an anchorage-independent manner was initially assayed in vitro by colony formation in soft agar. All of the cell lines established from the tumors in the DCT-TVA/Ink4a/Arf lox/lox mice injected with NRASQ61R and Cre viruses formed multiple colonies in soft agar, a characteristic of transformed cells. The number of colonies formed from three representative cell lines as well as a positive and negative control is shown in Supplementary Figure 6. While anchorage-independent growth suggests that these cells are transformed, a more stringent assay of tumorigenic potential is the ability to form tumors in vivo. To determine the relative efficiency of tumor formation in vivo, explanted tumor cells were injected subcutaneously into nude mice. Whereas the mice injected with 1 × 10⁷ immortal melanocytes did not produce tumors within the 8-week experimental timeframe, all of the mice injected with 1 × 10⁷ cells explanted from the tumors in the DCT-TVA/Ink4a/Arf lox/lox mice infected with NRASQ61R and Cre viruses succumbed to tumors rapidly (41 ± 1.35 days, n = 10) further verifying that these cells are tumorigenic (Supplementary Table 1).
NRASQ61R-Ink4a/Arf -/- tumor cells are syngeneic with the DCT-TVA/Ink4a/Arf lox/lox strain
The explanted tumor cells were also injected subcutaneously into the flanks of DCT-TVA/Ink4a/Arf lox/lox mice to determine if they were syngeneic and could form tumors in an immune-competent host. All of the mice injected with 1 × 10⁷ cells formed tumors whereas 40 % of the mice injected with 5 × 10⁶ cells formed tumors (Figure 4). These data suggest that these tumor cells are syngeneic with the DCT-TVA/Ink4a/Arf lox/lox strain; however, latency of tumor formation in the DCT-TVA/Ink4a/Arf lox/lox mice injected with 1 × 10⁷ cells (93.3 ± 5.78 days, n = 7) was significantly longer than that in nude mice injected with the same type and number of cells (41 ± 1.35 days, n = 10). Serial passage of these tumor cells in DCT-TVA/Ink4a/Arf lox/lox mice selected for aggressive melanoma cell variants and resulted in significantly reduced survival times (37.8 ± 2.04 days, n = 17) when compared with the non-passaged cells (P = 1.97 × 10⁻⁵) (Figure 4). Survival of DCT-TVA/Ink4a/Arf lox/lox mice injected with the passaged tumor cells was not significantly different than that observed in nude mice (P = 0.67). After three rounds (3×) of passaging in vivo, tumors formed in DCT-TVA/Ink4a/Arf lox/lox mice injected with significantly fewer numbers of tumor cells. Mice injected with 1 × 10⁶ 3× passaged cells formed tumors in all injected mice within 25.5 ± 0.81 days (n = 15). All mice injected with 5 × 10⁴ or 5 × 10³ cells also formed tumors albeit with slightly longer latency (Supplementary Table 1).
Figure 4. Kaplan-Meier percent survival curve.

DCT-TVA/Ink4a/Arf lox/lox mice were injected subcutaneously with a cell line derived from an explanted melanoma: 5 × 10⁶ cells n = 10 (large dashed line) and 1× 10⁷ cells n = 7 (solid line). 1× 10⁷ cells that had been passaged in vivo were re-injected n = 17 (small dashed line).
Development of spontaneous metastases following subcutaneous injection of in vivo passaged tumor cells
All major organs of mice injected subcutaneously with tumor cells were thoroughly examined. In one mouse, tumor cells involved the kidney but it is unclear whether this involvement was direct extension or metastasis. A comprehensive histological and immunohistochemical evaluation of this tumor involving the kidney is shown in Supplementary Figure 7. Interestingly, peritoneal metastases were detected in three mice (Supplementary Figure 8) and a lung metastasis was detected in one mouse 20 days following subcutaneous injection of 5 × 10⁴ tumor cells into the flank (Figure 5a-b). Two of the peritoneal metastases appeared to have arisen from the pancreas and included pancreatic duct and disrupted endocrine cells. Both tumors were observed to be in the process of invading into the adjacent duodenum as evidenced by trapped glandular epithelium within the tumor mass. Tumor cells were also detected in the kidney of one of these mice and in the esophagus of the second mouse (Supplementary Figure 8). In total, metastases were detected in ~30% (4/14) of the mice injected with passaged tumor cells. The histologic appearances of the primary tumor and the metastases were indistinguishable (compare Figure 2 with Figures 5b and g). The lung metastasis stained positive for virally delivered NRASQ61R-HA confirming that the source of the tumor cells were those that were injected subcutaneously (Figure 5c). Nestin expression was high and uniform (Figure 5d). The cells were highly proliferative (Figure 5e) and NRAS was active as measured by phosphorylated Erk (Figure 5f). The tumor cells were positive for expression of HMB-45 and MART-1 demonstrating melanocytic origin (Figure 5h).
Figure 5. Evaluation of lung metastasis following subcutaneous injection of syngeneic tumor cells.

DCT-TVA/Ink4a/Arf lox/lox mice were injected subcutaneously with explanted tumor cells at birth. (a) Lung dissection showing multiple nodules (h identifies the heart; scale bar is 0.5 cm). (b) H&E stained lung tumor section from a 23 day old mouse. (c) IHC for the HA epitope tag on NRASQ61R. (d) IHC for Nestin. (e) IHC for Ki67. (f) IHC for phosphorylated Erk (p-Erk). (g) IHC for HMB-45 and MART-1 (pan-MEL). Sections were counterstained with hematoxylin. Scale bars represent 200 μm for (b-g).
Discussion
We describe the development of a somatic cell gene delivery mouse model of melanoma that provides distinct advantages in the study of melanoma initiation, progression, and maintenance. Most importantly, validation of newly discovered genetic alterations in this disease can now be performed rapidly without the need to generate new transgenic or knockout mice. Furthermore, by delivering oncogenes to a small percentage of cells that are surrounded by normal cells, this model closely mimics the human disease. This system also allows for temporal (Holmen and Williams, 2005, Pao et al., 2003) and spatial control of gene expression or loss (Bromberg-White et al., 2004, Seidler et al., 2008).
We demonstrate that the combination of NRASQ61R and Ink4a/Arf loss, two common genetic alterations in human melanoma, produce lesions that are histologically similar to human melanoma. In contrast, the combination of KRASG12D and Ink4a/Arf loss is not tumorigenic in this model. The RAS isoforms share a high degree of homology with differences mainly in the C-terminal hypervariable region (Giehl, 2005). We previously reported that expression of mutant NRAS increased the rate of proliferation of immortal melanocytes in vitro and was more potently transforming compared with melanocytes expressing mutant KRAS (Whitwam et al., 2007). These differences were due to the ability of NRAS, but not KRAS, to prevent GSK-3-mediated phosphorylation of c-MYC and likely explain the inability of mutant KRAS to induce melanoma in this model.
Melanocyte specific expression of HRasG12V and NRasQ61K on an Ink4a/Arf-deficient background induced tumors with comparable histology; however, in contrast to the model presented here, tumor development in tyrosinase-driven HRasG12V and NRasQ61K transgenic models required a median latency of ~6 months. Induction of melanoma with tyrosinase driven expression of HRasG12V in combination with DMBA treatment induced tumors with a latency of 3-6 months but the cooperating genetic events were not defined (Broome Powell et al., 1999). It is possible that the nature of the mutation in Ras or mouse strain may impact tumor latency. Alternatively, it is likely that this difference is due to the promoter used. Tyrosinase is active in more differentiated cells in comparison with the Dct promoter, which is active in stem and progenitor cells. Furthermore, during the course of development, founder mice with higher levels of tyrosinase-driven Ras expression were selected against (Chin et al., 1997). By delivering NRASQ61R postnatally, this model avoids any potential detrimental effects on embryonic development. In addition, the virally delivered genes are expressed from the viral LTR promoter and are not under the control of the melanocyte differentiation program. Importantly, expression of NRASQ61R from the virus is not significantly different than the levels of endogenous NRas in uninfected control melanocytes (Supplementary Figure 5).
While distant metastases did not develop from the tumors induced by viral infection, ~30% of mice injected with tumor cells that were passaged in vivo developed metastases. This suggests that serial passage in vivo selected for aggressive melanoma cell variants capable of disseminating to the peritoneum and the lungs. Alternatively, the lack of metastases in tumors induced by viral infection may be due to the rate at which these tumors developed; it is possible that due to the rapid growth of the primary tumor there was not sufficient time for metastases to form. Future studies will involve characterizing the differences between the parental tumor cell lines and their progeny to identify alterations responsible for disease progression. This model system is ideal for validating genes implicated in melanoma metastasis.
The incomplete penetrance of tumor formation in this model may be due to several factors. It is clear that tumor formation requires that both NRASQ61R and Cre expression occurs within the same cell. Delivery of just one of these genes did not result in tumor formation during the 14 week experimental period and linking expression of NRASQ61R and Cre into one vector with an IRES nearly doubled the incidence to 63%. DCT is expressed in all melanocyte lineage cells starting at E10.5 (Inoue-Narita et al., 2008), but mature melanocytes in the hair matrix are known to undergo apoptosis during catagen (Tobin et al., 1998). It is likely that in order for tumors to form, infection must occur in melanocyte stem or progenitor cells capable of self-renewal and not differentiated melanocytes that have a finite life span. If this is the case, then it is possible that there are a small number of target cells and since melanocyte stem cells are slow-cycling this may decrease the likelihood of a productive infection because cell division is required for efficient retrovirus-mediated gene transfer. Further support for the presence of “stem-like” cells in these tumors was obtained by injecting limited numbers of tumor cells back into the mice. Tumors were induced in all injected mice albeit with delayed latency. We also observed expression of nestin, a marker of hair follicle stem cells (Hoffman, 2007), in all of our tumors but it remains unclear whether the cells expressed nestin prior to infection or if nestin expression was induced as a result of Ink4a/Arf loss. It is also possible that high MAPK activity is not tolerated in these cells. There may be a narrow window in which NRASQ61R expression and the level of MAPK activity is tolerated that enables tumor formation. Activity above or below this level may not lead to tumor development.
In conclusion, we have developed a mouse model ideally suited for testing the tumorigenic potential of candidate melanoma oncogenes in vivo. These retroviral vectors have also been used to express short hairpin RNA (shRNA) under the control of the H1 RNA polymerase III promoter for the purpose of inhibiting gene expression in a sequence-specific manner and therefore can be used to target tumor suppressor genes as well (Bromberg-White et al., 2004, Seidler et al., 2008). The versatility of this model eliminates the need to create a new transgenic mouse strain for each new gene to be studied and is therefore likely to accelerate the pace of discovery. These animals allow the study of tumor progression and will also be valuable for preclinical testing of novel therapeutic agents.
Methods
Mice and genotyping
All experiments were performed in compliance with the guiding principles of the “Care and Use of Animals” (available at HUhttp://www.nap.edu/books/0309053773/html/UH) and were approved by the Institutional Animal Care and Use Committee (IACUC) prior to experimentation. DCT-TVA mice (Dunn et al., 2000) and Ink4a/Arf lox/lox mice (Aguirre et al., 2003) have been described. The Ink4a/Arf lox/lox mice were bred onto an FVB/n background by four generations of backcrossing (Aguirre et al., 2003). The DCT-TVA mice were generated in FVB/n mice and therefore mating with the Ink4a/Arf lox/lox mice resulted in a fifth generation backcross. The mice have been mated brother × sister for more than 20 consecutive generations, and individuals of the strain can be traced to a single ancestral pair. At this point the individuals’ genomes (excluding any genetic drift) can be regarded for most purposes as genetically identical. DNA was prepared from tail biopsies and genotyped by PCR for the TVA transgene as described (Holmen and Williams, 2005). PCR to detect a 180-bp Ink4a/Arf lox allele and a 140 bp wild-type Ink4a/Arf allele was carried out with the following primer sequences: Fwd 5′-TTGTTGGCCCAGGATGCCGACATC-3′; Rev 5′-CCAAGTGTGCAAACCCAGGCTCC-3′.
Establishment of melanoma cell lines and culture conditions
Melanoma cell lines were established following dissection of primary tumors by physical disruption into single cells using scalpels and trypsin. Melanocyte/melanoma cultures were maintained in 254 medium containing human melanocyte growth supplement (HMGS) (Cascade Biologics, Portland, OR), 10% FBS, and 50 μg/ml gentamicin at 37 °C with 5% CO2. DF-1 cells were grown in DMEM-high glucose supplemented with 10% fetal bovine serum (BioWhitaker, Walkersville, MD), 1 × penicillin/streptomycin, and maintained at 39 °C (Schaefer-Klein et al., 1998).
Viral constructs
The retroviral vectors used in this study were replication-competent avian leukosis virus (ALV) long terminal repeat (LTR), splice acceptor, and Bryan polymerase-containing vectors of envelope subgroup A [designated RCASBP(A)] (Supplementary Figure 9). RCASBP(A)GFP (Du et al., 2006), RCASBP(A)NRASQ61R (Whitwam et al., 2007), RCASBP(A)KRASG12D, and RCASBP(A)Cre (Robinson et al., 2010) have been described. To generate RCASBP(A)NRASQ61R-IRES-Cre, NRASQ61R was PCR amplified from RCASBP(A)NRASQ61R and cloned into pENTR3C (Invitrogen, Carlsbad, CA) via Bam HI (5′) and Eco RI (3′). The IRES was PCR amplified from pIRES (Clontech, Mountain View, CA) and cloned into pENTR3C-NRASQ61R by Not I and Xho I. Cre recombinase was obtained through PCR amplification of RCASBP(A)Cre (Robinson et al., 2010) and subsequent cloning into pENTR3C-NRASQ61R-IRES by Xho I and Xba I. RCASBP(A)NRASQ61R-IRES-Cre was generated by mixing pENTR3C-NRASQ61R-IRES-Cre with the RCASBP(A) destination vector in the presence of the LR Clonase Enzyme Mix as described (Bromberg-White et al., 2004). All PCR products were sequence verified. Primer sequences are available upon request.
Virus production
Virus infection was initiated by calcium phosphate transfection of plasmid DNA that contained the retroviral vector in proviral form in DF-1 cells as previously described (Holmen et al., 1999). Viral spread was monitored by assaying culture supernatants for ALV capsid protein by ELISA as previously described (Smith et al., 1979). Virus stocks were generated from the cell supernatants. The supernatants were filtered through a 0.45-μm filter, and stored at −80 °C.
Viral infections in vitro
Melanocytes were seeded in 6-well plates at a density of 5 × 10⁴ cells/well and were maintained in 254 Medium with 10% FBS, 1 × penicillin/streptomycin at 37 °C. After the cells attached, 1 ml of filtered virus-containing medium was added in the presence of 8 μg/ml polybrene (Sigma, St. Louis, MO) for 2 h at 37 °C.
Soft-agar assays
To assess anchorage-independent growth, 1.5 × 10⁵ cells were suspended in 0.55% Difco agar noble (Becton Dickinson, Sparks, MD) in MGM/10% FBS and layered over pre-solidified 0.65% Difco Noble Agar in MGM/10% FBS per well of a 6-well dish. Each cell line was assayed in triplicate.
Tumorigenicity assays
Athymic nude mice or DCT-TVA;Ink4a/Arf lox/lox mice were injected subcutaneously with the indicated number of cells in 100 μl Hanks’ balanced salt solution. Tumor size was evaluated by caliper measurements, and tumor volume was calculated by length × width × depth.
In vivo infection
Infected DF-1 cells from a confluent culture in a 10-cm dish were trypsinized, pelleted, resuspended in 50 μl PBS, and placed on ice. Newborn mice were injected with 10 μl of cells subcutaneously near the outer ear as this area has been shown to have a high density of melanocytes (Zhao and Overbeek, 1999). All mice were monitored for tumor development daily.
Immunohistochemistry (IHC)
NRASQ61R-HA expression was detected using an antibody to the HA epitope (HA.11, Covance, Berkely, CA) (diluted 1:1000). Cell proliferation was detected using an antibody to Ki67 (M7246, Dako, Carpinteria, CA) (diluted 1:50). The following additional antibodies were used at a 1:200 dilution: Nestin (ab6142, Abcam, Cambridge, MA), p70 S6 Kinase (2708, Cell Signaling, Boston, MA), GFAP (13-0300, Zymed, San Francisco, CA) and S100 (Z0311, Dako). Detection of MAPK activation was performed using a 1:100 dilution of an antibody to phospho-Erk (4370, Cell Signaling, Boston, MA). HMB-45 and MART-1 were detected using a 1:25 dilution of an antibody cocktail (AB732, Abcam, Cambridge, MA). All sections were counterstained with hematoxylin.
Immunoblotting
Blots were immunostained for NRASQ61R-HA using an anti-HA antibody (HA.11, Covance) at a 1:1000 dilution or an NRAS specific antibody (SC-31, Santa Cruz Biotechnology, Santa Cruz, CA) at a 1:200 dilution. Arf was detected using an anti-p19Arf antibody (ab80, Abcam) at a 1:50 dilution. Ras activity was measured using anti-phospho-ERK (9106, Cell Signaling), and total ERK (9102, Cell Signaling). Blots were re-probed with anti-α-tubulin antibody (T-9026, Sigma) at a 1:1000 dilution as a loading control. Detection was performed using anti-mouse or anti-rabbit IgG-HRP secondary antibodies as appropriate diluted 1:1000 (Cell Signaling). The blots were incubated in ECL solutions per the manufacturer’s specifications (Amersham, Piscataway, NJ) and exposed to film.
Fluorescence Imaging
Intravital images were acquired with a Zeiss LSM 510 non-linear optics laser scanning confocal/multiphoton microscope equipped with a Coherent Mira 900 tunable femtosecond Ti:Sapphire laser and META spectral detector. The laser for two-photon imaging was tuned to 880 nm for selective excitation of eGFP. Emitted fluorescence was captured via the photomultiplier tube as a 512 × 512 pixel image file with an image depth of 8 bits. Images were processed for contrast and brightness and analyzed with the use of Image Pro Plus v4.1 software (Media Cybernetics, Silver Spring, MD). Whole body fluorescence was detected using the FluorVivo Imaging System (INDEC Biosystems, Santa Clara, CA).
Statistical Analysis
Censored survival data was analyzed using a log-rank test of the Kaplan-Meier estimate of survival. For tumorigenicity assays, each cell line was assayed according to the n indicated and the data is represented as the mean ± S.E.M. Density analysis was performed using Image J and the data is represented as mean ± S.D.
Significance.
Melanoma is the most rapidly increasing malignancy worldwide. The increased incidence combined with the poor prognosis of patients with advanced disease make it imperative that we increase our understanding of the underlying genetic causes of melanoma such that better targeted therapeutic strategies can be developed. To this end, we have developed a retroviral somatic cell gene delivery model of melanoma that allows for tissue- and cell-specific targeted infection of mammalian cells through ectopic expression of the viral receptor. This model closely resembles the human disease where tumors evolve from mutant genes in developmentally normal somatic cells and can be used to rapidly validate genes implicated in melanoma genesis and progression. This model is also valuable for preclinical testing of therapeutic agents in vivo.
Supplementary Material
Supplementary Figure 1. Schematic of the DCT-TVA melanoma mouse model and associated procedures. DCT-TVA mice were crossed with Ink4a/Arf lox/lox mice to generate DCT-TVA;Ink4a/Arf lox/lox mice. TVA negative mice were used as controls. All mice were injected subcutaneously with the indicated viruses at birth. Melanocytes and tumors were isolated and established in culture. Further analysis of tumorigenicity was performed in nude mice and the DCT-TVA;Ink4a/Arf lox/lox mouse strain.
Supplementary Table 1. Tumorigenicity of primary tumor cells following subcutaneous injection into Nude or DCT-TVA/Ink4a/Arf lox/lox mice.
Supplementary Figure 2. Fluorescent intravital imaging of GFP in RCASBP(A)GFP injected DCT-TVA mice. (a-d) Confocal/multi-photon intravital imaging. (a) RCASBP(A)GFP infected DF-1 cells imaged prior to injection. (b) Image of a DCT-TVA mouse 5 min. post injection. (c) RCASBP(A)GFP injected TVA-negative mouse 3 weeks post injection. (d) TVA-negative mouse 3 weeks post injection with RCASBP(A)GFP infected viral producing cells. (e-j) Whole body fluorescent imaging using the FluorVivo system. Each image represents a different time point post injection, indicated in hours (h).
Supplementary Figure 3. Characterization of tumors in DCT-TVA/Ink4a/Arf lox/lox mice induced by expression of NRAS-IRES-Cre. Mice were injected with NRASQ61R-IRES-Cre viral producing cells at birth. (a and c) H&E stained tumor sections from a representative mouse (age 39 days). (b) IHC for the HA epitope tag on NRASQ61R. (d) IHC for HMB-45 and MART-1 (pan-MEL). All sections were counterstained with hematoxylin. Scale bars represent 200 μm for all sections.
Supplementary Figure 4. Characterization of a tumor with brain involvement in an injected DCT-TVA/Ink4a/Arf lox/lox mouse. Mice were injected with NRASQ61R-HA and Cre viruses at birth. (a-b) H&E stained tumor sections from a representative mouse (age 44 days). (c-d) IHC for the HA epitope tag on NRASQ61R. (e-f) IHC for Ki67. (g-h) IHC for GFAP. (i-j) IHC for Nestin. All sections were counterstained with hematoxylin. Scale bar represents 200 μm for all sections.
Supplementary Figure 5. NRas expression in explanted melanoma cells. Expression of endogenous NRas and virally delivered NRASQ61R-HA from D6-MEL immortal melanocytes (control) and three different tumor samples (336, 335 and 333). The cells were lysed in SDS lysis buffer and separated on 4-20% gradient polyacrylamide gels. Expression from the virus was compared to endogenous NRas expression using an NRAS specific antibody. NRASQ61R-HA can be distinguished by its slower migration through the gel resulting from the addition of the HA tag. The blots were re-probed with α-tubulin as a loading control. The levels of virally delivered NRASQ61R-HA expression from three separate samples were not significantly different than the level of endogenous NRas expression in the control cells. Band density was quantitated using Image J, normalized to tubulin levels, and compared with the control. Sample 336 NRASQ61R-HA (top band) was 99 ± 6.3%, sample 335 was 109 ± 6.7% and sample 332 was 86 ± 10.0% compared with control endogenous NRas expression.
Supplementary Figure 6. Growth of melanoma cells in soft agar. Cells were seeded at a density of 1.5 × 10⁵ per well in a 6-well dish. D6-MEL cells are previously described immortal Ink4a/Arf-deficient melanocytes that served as a negative control (Whitwam et al., 2007). D6-NRAS are D6-MEL cells expressing NRASQ61R that served as a positive control. Each cell line was assayed in triplicate. Data are expressed as the mean ± S.E.M.
Supplementary Figure 7. Characterization of a syngeneic tumor with kidney invasion in a DCT-TVA/Ink4a/Arf lox/lox mouse. Mice were injected subcutaneously with explanted tumor cells at birth. (a-b) H&E stained tumor sections from a representative mouse (age 78 days). (c-d) IHC for the HA epitope tag on NRASQ61R. (e-f) IHC for phosphorylated Erk (p-Erk). (g-h) IHC for phosphorylated p70 S6 kinase (p-S6K). (i-j) IHC for Ki67. (k-l) IHC for Nestin. All sections were counterstained with hematoxylin. Scale bar represents 200 μm for all sections.
Supplementary Figure 8. Peritoneal metastases detected in DCT-TVA/Ink4a/Arf lox/lox mice injected subcutaneously with syngeneic tumor cells. Mice were injected subcutaneously with explanted tumor cells at birth. (a-i) Representative H&E stained tumor sections from 3 different mice. Tumor cells were detected within the (a) kidney, (b-e) pancreas, (f-g) intestine and (i) esophagus. (h) lymph nodes were frequently involved by primary tumors and metastases. Scale bars represent 200 μm for all sections.
Supplementary Figure 9. Schematic representation of the viral vectors. These vectors are all Gateway compatible to allow for the easy insertion of experimental sequences. LTR, long terminal repeat; Ψ, packaging signal; SD, splice donor; SA, splice acceptor.
Acknowledgements
We thank the members of the Holmen lab as well as J. Resau, E. Hudson, S. Hughes, B. Lewis, Y. Li, W. Pavan, T. Hornyak, E. Holland, R. DePinho, L. Chin, and M. McMahon for providing mouse strains, reagents, support, and advice. We thank the Nevada Cancer Institute Mouse and Histology cores for assistance. The histology core is supported by NIH Grant Number P20 RR-016464 from the INBRE Program of the National Center for Research Resources. This work was supported by grants from the Melanoma Research Foundation and by Award Number R01CA121118 from the National Cancer Institute. The content is solely the responsibility of the authors and does not necessarily represent the official views of the National Cancer Institute or the National Institutes of Health.
References
- Ackermann J, Frutschi M, Kaloulis K, Mckee T, Trumpp A, Beermann F. Metastasizing melanoma formation caused by expression of activated N-RasQ61K on an INK4a-deficient background. Cancer Res. 2005;65:4005–11. doi: 10.1158/0008-5472.CAN-04-2970. [DOI] [PubMed] [Google Scholar]
- Aguirre AJ, Bardeesy N, Sinha M, Lopez L, Tuveson DA, Horner J, Redston MS, Depinho RA. Activated Kras and Ink4a/Arf deficiency cooperate to produce metastatic pancreatic ductal adenocarcinoma. Genes Dev. 2003;17:3112–26. doi: 10.1101/gad.1158703. [DOI] [PMC free article] [PubMed] [Google Scholar]
- Ahmed I. Malignant melanoma: prognostic indicators. Mayo Clin Proc. 1997;72:356–61. doi: 10.4065/72.4.356. [DOI] [PubMed] [Google Scholar]
- Barbacid M. ras oncogenes: their role in neoplasia. Eur J Clin Invest. 1990;20:225–35. doi: 10.1111/j.1365-2362.1990.tb01848.x. [DOI] [PubMed] [Google Scholar]
- Bromberg-White JL, Webb CP, Patacsil VS, Miranti CK, Williams BO, Holmen SL. Delivery of short hairpin RNA sequences by using a replication-competent avian retroviral vector. J Virol. 2004;78:4914–6. doi: 10.1128/JVI.78.9.4914-4916.2004. [DOI] [PMC free article] [PubMed] [Google Scholar]
- Broome Powell M, Gause PR, Hyman P, Gregus J, Lluria-Prevatt M, Nagle R, Bowden GT. Induction of melanoma in TPras transgenic mice. Carcinogenesis. 1999;20:1747–53. doi: 10.1093/carcin/20.9.1747. [DOI] [PubMed] [Google Scholar]
- Castellano M, Parmiani G. Genes involved in melanoma: an overview of INK4a and other loci. Melanoma Res. 1999;9:421–32. [PubMed] [Google Scholar]
- Chin L, Garraway LA, Fisher DE. Malignant melanoma: genetics and therapeutics in the genomic era. Genes Dev. 2006;20:2149–2182. doi: 10.1101/gad.1437206. [DOI] [PubMed] [Google Scholar]
- Chin L, Pomerantz J, Polsky D, Jacobson M, Cohen C, Cordon-Cardo C, Horner JW, 2nd, Depinho RA. Cooperative effects of INK4a and ras in melanoma susceptibility in vivo. Genes Dev. 1997;11:2822–34. doi: 10.1101/gad.11.21.2822. [DOI] [PMC free article] [PubMed] [Google Scholar]
- Chin L, Tam A, Pomerantz J, Wong M, Holash J, Bardeesy N, Shen Q, O’hagan R, Pantginis J, Zhou H, et al. Essential role for oncogenic Ras in tumour maintenance. Nature. 1999;400:468–72. doi: 10.1038/22788. [DOI] [PubMed] [Google Scholar]
- Dankort D, Curley DP, Cartlidge RA, Nelson B, Karnezis AN, Damsky WE, Jr, You MJ, Depinho RA, Mcmahon M, Bosenberg M. Braf(V600E) cooperates with Pten loss to induce metastatic melanoma. Nat Genet. 2009;41:544–52. doi: 10.1038/ng.356. [DOI] [PMC free article] [PubMed] [Google Scholar]
- Davies H, Bignell GR, Cox C, Stephens P, Edkins S, Clegg S, Teague J, Woffendin H, Garnett MJ, Bottomley W, et al. Mutations of the BRAF gene in human cancer. Nature. 2002;417:949–54. doi: 10.1038/nature00766. [DOI] [PubMed] [Google Scholar]
- Dhomen N, Reis-Filho JS, Da Rocha Dias S, Hayward R, Savage K, Delmas V, Larue L, Pritchard C, Marais R. Oncogenic Braf induces melanocyte senescence and melanoma in mice. Cancer Cell. 2009;15:294–303. doi: 10.1016/j.ccr.2009.02.022. [DOI] [PubMed] [Google Scholar]
- Du Z, Podsypanina K, Huang S, Mcgrath A, Toneff MJ, Bogoslovskaia E, Zhang X, Moraes RC, Fluck M, Allred DC, et al. Introduction of oncogenes into mammary glands in vivo with an avian retroviral vector initiates and promotes carcinogenesis in mouse models. Proc Natl Acad Sci U S A. 2006;103:17396–401. doi: 10.1073/pnas.0608607103. [DOI] [PMC free article] [PubMed] [Google Scholar]
- Dunn KJ, Brady M, Ochsenbauer-Jambor C, Snyder S, Incao A, Pavan WJ. WNT1 and WNT3a promote expansion of melanocytes through distinct modes of action. Pigment Cell Res. 2005;18:167–80. doi: 10.1111/j.1600-0749.2005.00226.x. [DOI] [PubMed] [Google Scholar]
- Dunn KJ, Incao A, Watkins-Chow D, Li Y, Pavan WJ. In utero complementation of a neural crest-derived melanocyte defect using cell directed gene transfer. Genesis. 2001;30:70–6. doi: 10.1002/gene.1035. [DOI] [PubMed] [Google Scholar]
- Dunn KJ, Williams BO, Li Y, Pavan WJ. Neural crest-directed gene transfer demonstrates Wnt1 role in melanocyte expansion and differentiation during mouse development. Proc Natl Acad Sci U S A. 2000;97:10050–5. doi: 10.1073/pnas.97.18.10050. [DOI] [PMC free article] [PubMed] [Google Scholar]
- Federspiel M, Hughes S. Retroviral gene delivery. In: Emerson C, Sweeney H, editors. Methods in Cell Biology: Methods in Muscle Biology. Academic Press; San Diego: 1997. [PubMed] [Google Scholar]
- Federspiel MJ, Bates P, Young JA, Varmus HE, Hughes SH. A system for tissue-specific gene targeting: transgenic mice susceptible to subgroup A avian leukosis virus-based retroviral vectors. Proc Natl Acad Sci U S A. 1994;91:11241–5. doi: 10.1073/pnas.91.23.11241. [DOI] [PMC free article] [PubMed] [Google Scholar]
- Fisher GH, Orsulic S, Holland E, Hively WP, Li Y, Lewis BC, Williams BO, Varmus HE. Development of a flexible and specific gene delivery system for production of murine tumor models. Oncogene. 1999;18:5253–60. doi: 10.1038/sj.onc.1203087. [DOI] [PubMed] [Google Scholar]
- Giehl K. Oncogenic Ras in tumour progression and metastasis. Biol Chem. 2005;386:193–205. doi: 10.1515/BC.2005.025. [DOI] [PubMed] [Google Scholar]
- Goel VK, Ibrahim N, Jiang G, Singhal M, Fee S, Flotte T, Westmoreland S, Haluska FS, Hinds PW, Haluska FG. Melanocytic nevus-like hyperplasia and melanoma in transgenic BRAFV600E mice. Oncogene. 2009;28:2289–98. doi: 10.1038/onc.2009.95. [DOI] [PMC free article] [PubMed] [Google Scholar]
- Haluska FG, Hodi FS. Molecular genetics of familial cutaneous melanoma. J Clin Oncol. 1998;16:670–82. doi: 10.1200/JCO.1998.16.2.670. [DOI] [PubMed] [Google Scholar]
- Hoffman RM. The potential of nestin-expressing hair follicle stem cells in regenerative medicine. Expert Opin Biol Ther. 2007;7:289–91. doi: 10.1517/14712598.7.3.289. [DOI] [PubMed] [Google Scholar]
- Holmen SL, Salter DW, Payne WS, Dodgson JB, Hughes SH, Federspiel MJ. Soluble forms of the subgroup A avian leukosis virus [ALV(A)] receptor Tva significantly inhibit ALV(A) infection in vitro and in vivo. J Virol. 1999;73:10051–60. doi: 10.1128/jvi.73.12.10051-10060.1999. [DOI] [PMC free article] [PubMed] [Google Scholar]
- Holmen SL, Williams BO. Essential role for Ras signaling in glioblastoma maintenance. Cancer Res. 2005;65:8250–5. doi: 10.1158/0008-5472.CAN-05-1173. [DOI] [PubMed] [Google Scholar]
- Inoue-Narita T, Hamada K, Sasaki T, Hatakeyama S, Fujita S, Kawahara K, Sasaki M, Kishimoto H, Eguchi S, Kojima I, et al. Pten deficiency in melanocytes results in resistance to hair graying and susceptibility to carcinogen-induced melanomagenesis. Cancer Res. 2008;68:5760–8. doi: 10.1158/0008-5472.CAN-08-0889. [DOI] [PubMed] [Google Scholar]
- Jemal A, Siegel R, Ward E, Hao Y, Xu J, Thun MJ. Cancer statistics, 2009. CA Cancer J Clin. 2009;59:225–49. doi: 10.3322/caac.20006. [DOI] [PubMed] [Google Scholar]
- Lewis TS, Shapiro PS, Ahn NG. Signal transduction through MAP kinase cascades. In: Vande Woude GF, Klein G, editors. Advances in Cancer Research. Academic Press; San Diego: 1998. [DOI] [PubMed] [Google Scholar]
- Meier F, Satyamoorthy K, Nesbit M, Hsu MY, Schittek B, Garbe C, Herlyn M. Molecular events in melanoma development and progression. Front Biosci. 1998;3:D1005–10. doi: 10.2741/a341. [DOI] [PubMed] [Google Scholar]
- Ohsie SJ, Sarantopoulos GP, Cochran AJ, Binder SW. Immunohistochemical characteristics of melanoma. J Cutan Pathol. 2008;35:433–44. doi: 10.1111/j.1600-0560.2007.00891.x. [DOI] [PubMed] [Google Scholar]
- Pao W, Klimstra DS, Fisher GH, Varmus HE. Use of avian retroviral vectors to introduce transcriptional regulators into mammalian cells for analyses of tumor maintenance. Proc Natl Acad Sci U S A. 2003;100:8764–9. doi: 10.1073/pnas.1133333100. [DOI] [PMC free article] [PubMed] [Google Scholar]
- Pho L, Grossman D, Leachman SA. Melanoma genetics: a review of genetic factors and clinical phenotypes in familial melanoma. Curr Opin Oncol. 2006;18:73–179. doi: 10.1097/01.cco.0000208791.22442.09. [DOI] [PubMed] [Google Scholar]
- Reifenberger J, Knobbe CB, Sterzinger AA, Blaschke B, Schulte KW, Ruzicka T, Reifenberger G. Frequent alterations of Ras signaling pathway genes in sporadic malignant melanomas. Int J Cancer. 2004;109:377–84. doi: 10.1002/ijc.11722. [DOI] [PubMed] [Google Scholar]
- Robinson JP, Vanbrocklin MW, Guilbeault AR, Signorelli DL, Brandner S, Holmen SL. Activated BRAF induces gliomas in mice when combined with Ink4a/Arf loss or Akt activation. Oncogene. 2010;29:335–44. doi: 10.1038/onc.2009.333. [DOI] [PMC free article] [PubMed] [Google Scholar]
- Schaefer-Klein J, Givol I, Barsov EV, Whitcomb JM, Vanbrocklin M, Foster DN, Federspiel MJ, Hughes SH. The EV-O-derived cell line DF-1 supports the efficient replication of avian leukosis-sarcoma viruses and vectors. Virology. 1998;248:305–11. doi: 10.1006/viro.1998.9291. [DOI] [PubMed] [Google Scholar]
- Seidler B, Schmidt A, Mayr U, Nakhai H, Schmid RM, Schneider G, Saur D. A CreloxP-based mouse model for conditional somatic gene expression and knockdown in vivo by using avian retroviral vectors. Proc Natl Acad Sci U S A. 2008;105:10137–42. doi: 10.1073/pnas.0800487105. [DOI] [PMC free article] [PubMed] [Google Scholar]
- Shukla VK, Hughes DC, Hughes LE, Mccormick F, Padua RA. ras mutations in human melanotic lesions: K-ras activation is a frequent and early event in melanoma development. Oncogene Res. 1989;5:121–7. [PubMed] [Google Scholar]
- Smith EJ, Fadly A, Okazaki W. An enzyme-linked immunosorbent assay for detecting avian leukosis-sarcoma viruses. Avian Dis. 1979;23:698–707. [PubMed] [Google Scholar]
- Steel KP, Davidson DR, Jackson IJ. TRP-2/DCT, a new early melanoblast marker, shows that steel growth factor (c-kit ligand) is a survival factor. Development. 1992;115:1111–9. doi: 10.1242/dev.115.4.1111. [DOI] [PubMed] [Google Scholar]
- Tobin DJ, Hagen E, Botchkarev VA, Paus R. Do hair bulb melanocytes undergo apoptosis during hair follicle regression (catagen)? J Invest Dermatol. 1998;111:941–7. doi: 10.1046/j.1523-1747.1998.00417.x. [DOI] [PubMed] [Google Scholar]
- Whitwam T, Vanbrocklin MW, Russo ME, Haak PT, Bilgili D, Resau JH, Koo HM, Holmen SL. Differential oncogenic potential of activated RAS isoforms in melanocytes. Oncogene. 2007;26:4563–70. doi: 10.1038/sj.onc.1210239. [DOI] [PubMed] [Google Scholar]
- Zhao S, Overbeek PA. Tyrosinase-related protein 2 promoter targets transgene expression to ocular and neural crest-derived tissues. Dev Biol. 1999;216:154–63. doi: 10.1006/dbio.1999.9480. [DOI] [PubMed] [Google Scholar]
Associated Data
This section collects any data citations, data availability statements, or supplementary materials included in this article.
Supplementary Materials
Supplementary Figure 1. Schematic of the DCT-TVA melanoma mouse model and associated procedures. DCT-TVA mice were crossed with Ink4a/Arf lox/lox mice to generate DCT-TVA;Ink4a/Arf lox/lox mice. TVA negative mice were used as controls. All mice were injected subcutaneously with the indicated viruses at birth. Melanocytes and tumors were isolated and established in culture. Further analysis of tumorigenicity was performed in nude mice and the DCT-TVA;Ink4a/Arf lox/lox mouse strain.
Supplementary Table 1. Tumorigenicity of primary tumor cells following subcutaneous injection into Nude or DCT-TVA/Ink4a/Arf lox/lox mice.
Supplementary Figure 2. Fluorescent intravital imaging of GFP in RCASBP(A)GFP injected DCT-TVA mice. (a-d) Confocal/multi-photon intravital imaging. (a) RCASBP(A)GFP infected DF-1 cells imaged prior to injection. (b) Image of a DCT-TVA mouse 5 min. post injection. (c) RCASBP(A)GFP injected TVA-negative mouse 3 weeks post injection. (d) TVA-negative mouse 3 weeks post injection with RCASBP(A)GFP infected viral producing cells. (e-j) Whole body fluorescent imaging using the FluorVivo system. Each image represents a different time point post injection, indicated in hours (h).
Supplementary Figure 3. Characterization of tumors in DCT-TVA/Ink4a/Arf lox/lox mice induced by expression of NRAS-IRES-Cre. Mice were injected with NRASQ61R-IRES-Cre viral producing cells at birth. (a and c) H&E stained tumor sections from a representative mouse (age 39 days). (b) IHC for the HA epitope tag on NRASQ61R. (d) IHC for HMB-45 and MART-1 (pan-MEL). All sections were counterstained with hematoxylin. Scale bars represent 200 μm for all sections.
Supplementary Figure 4. Characterization of a tumor with brain involvement in an injected DCT-TVA/Ink4a/Arf lox/lox mouse. Mice were injected with NRASQ61R-HA and Cre viruses at birth. (a-b) H&E stained tumor sections from a representative mouse (age 44 days). (c-d) IHC for the HA epitope tag on NRASQ61R. (e-f) IHC for Ki67. (g-h) IHC for GFAP. (i-j) IHC for Nestin. All sections were counterstained with hematoxylin. Scale bar represents 200 μm for all sections.
Supplementary Figure 5. NRas expression in explanted melanoma cells. Expression of endogenous NRas and virally delivered NRASQ61R-HA from D6-MEL immortal melanocytes (control) and three different tumor samples (336, 335 and 333). The cells were lysed in SDS lysis buffer and separated on 4-20% gradient polyacrylamide gels. Expression from the virus was compared to endogenous NRas expression using an NRAS specific antibody. NRASQ61R-HA can be distinguished by its slower migration through the gel resulting from the addition of the HA tag. The blots were re-probed with α-tubulin as a loading control. The levels of virally delivered NRASQ61R-HA expression from three separate samples were not significantly different than the level of endogenous NRas expression in the control cells. Band density was quantitated using Image J, normalized to tubulin levels, and compared with the control. Sample 336 NRASQ61R-HA (top band) was 99 ± 6.3%, sample 335 was 109 ± 6.7% and sample 332 was 86 ± 10.0% compared with control endogenous NRas expression.
Supplementary Figure 6. Growth of melanoma cells in soft agar. Cells were seeded at a density of 1.5 × 10⁵ per well in a 6-well dish. D6-MEL cells are previously described immortal Ink4a/Arf-deficient melanocytes that served as a negative control (Whitwam et al., 2007). D6-NRAS are D6-MEL cells expressing NRASQ61R that served as a positive control. Each cell line was assayed in triplicate. Data are expressed as the mean ± S.E.M.
Supplementary Figure 7. Characterization of a syngeneic tumor with kidney invasion in a DCT-TVA/Ink4a/Arf lox/lox mouse. Mice were injected subcutaneously with explanted tumor cells at birth. (a-b) H&E stained tumor sections from a representative mouse (age 78 days). (c-d) IHC for the HA epitope tag on NRASQ61R. (e-f) IHC for phosphorylated Erk (p-Erk). (g-h) IHC for phosphorylated p70 S6 kinase (p-S6K). (i-j) IHC for Ki67. (k-l) IHC for Nestin. All sections were counterstained with hematoxylin. Scale bar represents 200 μm for all sections.
Supplementary Figure 8. Peritoneal metastases detected in DCT-TVA/Ink4a/Arf lox/lox mice injected subcutaneously with syngeneic tumor cells. Mice were injected subcutaneously with explanted tumor cells at birth. (a-i) Representative H&E stained tumor sections from 3 different mice. Tumor cells were detected within the (a) kidney, (b-e) pancreas, (f-g) intestine and (i) esophagus. (h) lymph nodes were frequently involved by primary tumors and metastases. Scale bars represent 200 μm for all sections.
Supplementary Figure 9. Schematic representation of the viral vectors. These vectors are all Gateway compatible to allow for the easy insertion of experimental sequences. LTR, long terminal repeat; Ψ, packaging signal; SD, splice donor; SA, splice acceptor.