
Figure 6.
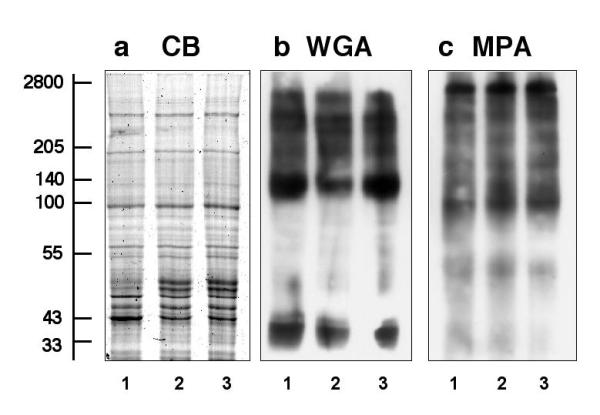
Analysis of microsomal preparations from normal, mdx and mdx-3cv brain. Shown is a Coomassie-stained gel (CB) (a) and identical blots labeled with the Tritium vulgaris lectin WGA (b) and the Maclura pomifera lectin MPA (c). Lanes 1 to 3 represent microsomal membranes isolated from normal brain, mdx brain, and mdx-3cv brain, respectively. The relative position of molecular mass standards (× 10-3) is indicated on the left.