Figure 1.

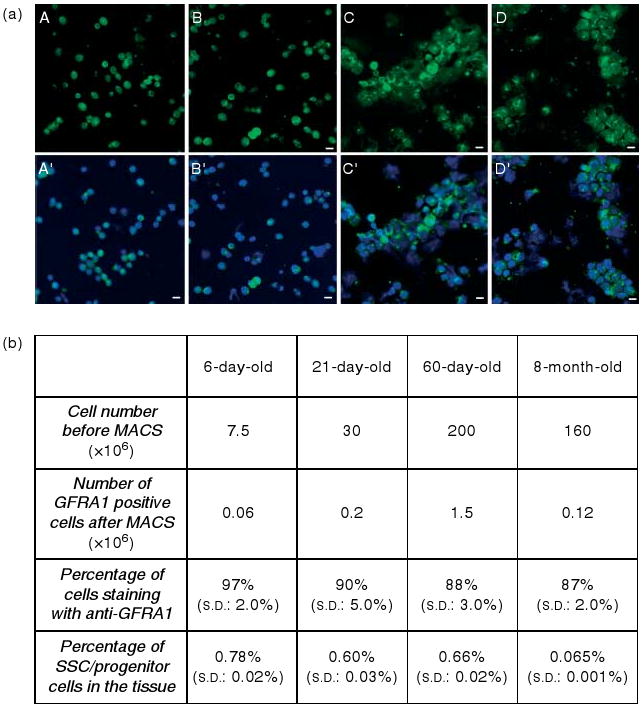
(a) GFRA1-positive cells isolated by immunomagnetic cell sorting from 6-day- (A, A′), 21-day- (B, B′), 60-day- (C, C′) and 8-month-old mouse testes, and stained with goat anti-GFRA1 and anti-goat-FITC. Nuclei were stained by DAPI. GFRA1-positive cells are shown in A–D, and merged with DAPI in A′, B′, C′, and D′ respectively. Scale bars = 10 μm. (b) Cell numbers before MACS in each age group, number of GFRA1-positive cells after MACS, percentage of cells stained with anti-GFRA1, and the estimated percentage of SSC/progenitor cells in the tissue. For example, the percentage of SSC/progenitors for the 6-day-old testis is (0.06/7.5) × 0.97 × 100 = 0.78%. s.d. from the two different cell isolations are also shown.
