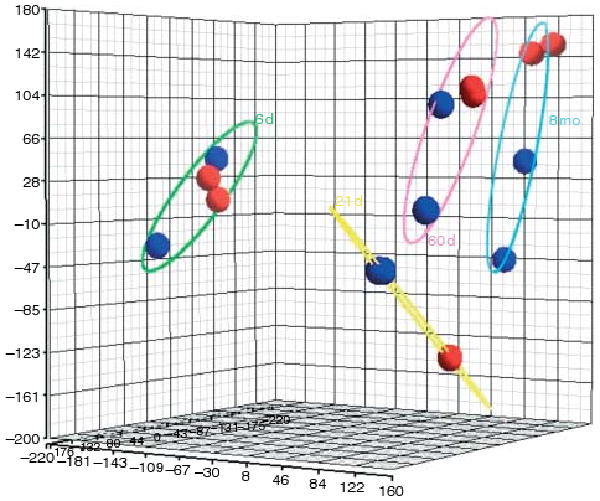
Figure 2.

PCA mapping for the microarray data. The gene expression data for each cell type are represented by different colors. GFRA1-positive cell gene expression is illustrated in red, and GFRA1-negative cell gene expression is illustrated in blue. The elliptical lines represent the four age groups, 6 days old (6 d), 21 days old (21 d), 60 days old (60 d), and 8 months old (8 mo). Duplicate red and blue circles represent the two different microarray experiments, representing different RNA isolations. In the 21-day-old age group, the duplicate experiments were almost identical. In all the groups, the gene expression profile of the GFRA1-positive cells appears distinct from that of the GFRA1-negative cells.
