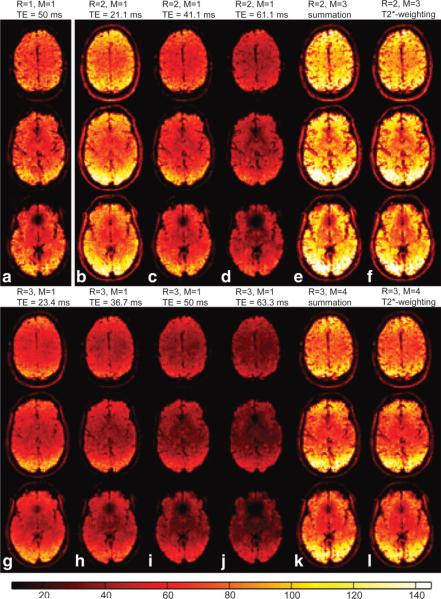
FIG. 2.
SFNR maps of selected slices in subject 1, session #3, for acquisitions with three different reduction factors: (a) R = 1, (b–f) R = 2, and (g–l) R = 3. For R = 2 and R = 3, SFNR maps of each individual echo image of a given acquisition are compared to SFNR maps of multiecho images generated using M echoes combined with echo summation (e,k) and -weighted echo combination (f,l). [Color figure can be viewed in the online issue, which is available at www.interscience.wiley.com.]

