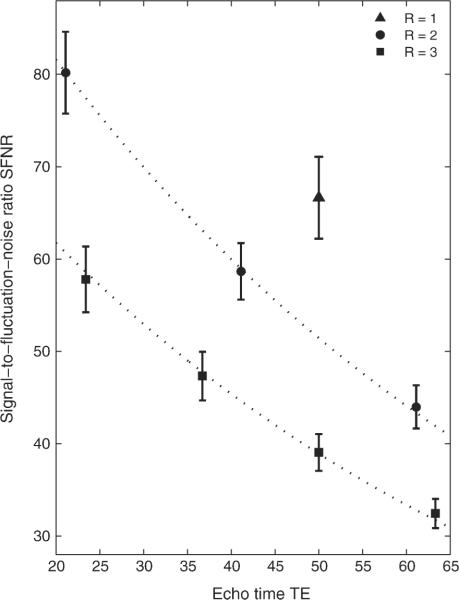
FIG. 3.
Measured SFNR, averaged over all subjects and sessions, retrieved from single-echo analysis (M = 1) of acquisitions with reduction factors R = 1–3. Dotted lines represent exponential decay of SFNR with , assuming average . Error bars represent the standard deviations over all subjects and sessions.

