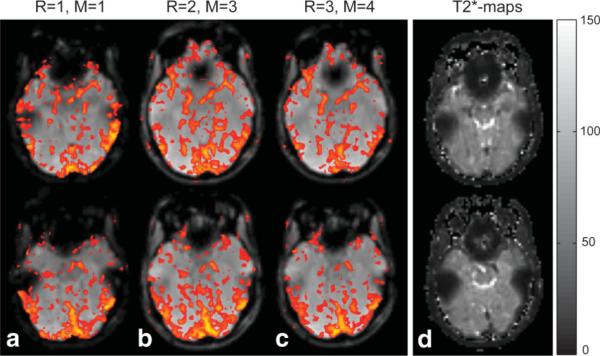
FIG. 5.
Selected slices with dropout regions above nasal cavities and next to the auditory canals, as typically seen in (a) nonaccelerated, single-echo, single-shot BOLD-fMRI experiments with long TE = 50 ms (R = 1). Using multiecho EPI acquisitions with (b) R = 2 and (c) R = 3, BOLD signal changes above threshold could be detected in such dropout regions. d: -maps of the corresponding slices show particularly small -values in these dropout regions (areas of short T*2 next to nasal cavities and auditory canals), while larger was found in more homogeneous brain regions, which do not suffer from the same susceptibility effects.

