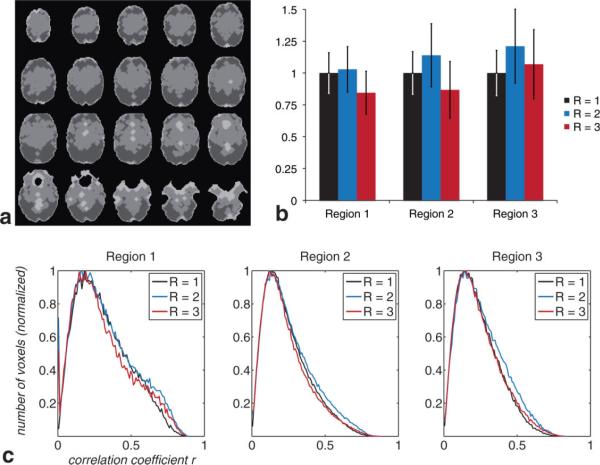
FIG. 6.
Region-specific assessment of multiecho acquisition schemes vs single-echo measurements. Analysis of TNAV and corresponding correlation coefficients separated into three regions (a): region 1, containing voxels with low SFNR (light gray); region 2, with average SFNR (medium gray); and region 3, with high SFNR (dark gray). b: Region-specific analysis of TNAV for nonaccelerated single-echo acquisition (R = 1), 2-fold accelerated three-echo acquisition (R = 2), and 3-fold accelerated four-echo acquisition (R = 3). Figure indicates average TNAV ± standard deviation over all subjects and sessions, normalized to the acquisition with R = 1 for each region. c: Histogram showing correlation coefficients for each acquisition scheme (cf. (b)), separated into the regions shown in (a).

